On-chain Metrics(Part-3)- Steemit Crypto Academy- S4W5- Homework Post for @sapwood

Q.1. How do you calculate Relative Unrealized Profit/Loss & SOPR? Examples? How are they different from MVRV Ratio?
RELATIVE UNREALIZED PROFIT/LOSS (RUPL)
When once an investor acquires an asset, there is bound to be profit/loss. Whenever the asset is sold, the profit/loss becomes realized (i.e realized profit/loss). However, before the asset is sold, the profit/loss accrued is unrealized (i.e unrealized profit/loss.
For UTXO cryptocurrencies, you calculate realized profits/losses using realized prices rather than market prices. Realized prices are the prices of the UTXO when it was last moved. This is material as the market price of the UTXO remains unrealized except the asset is sold.
After the UTXO has been moved, the prices continue to fluctuate. If the current price fluctuates above the realized price (i.e the price at which the UTXO was last moved) then we say there's profit but if the current price fluctuates below the realized price, then we say there is loss.
Recall that when the asset has not been sold, the profit or loss accrued has not been realized and so it's unrealized.
Crypto is tricky when it comes to 'when to sell'. You wouldn't want to sell when there's a chance the price could get higher and you wouldn't want to keep holding when there's a chance the price could drop further. Thus, it's important to study the unrealized profits/losses to help in the 'when to sell' decision.
Unrealized profit/loss is calculated by subtracting the realized price from the current price (i.e Current price - Realized price). It's a profit when it's positive and a loss when it's negative.
The behavior of the unrealized profit relative to the market cap can be determined and that behaviour is termed the relative unrealized profit/loss.
The relative unrealized profit/loss (RUPL) is calculated by
Unrealized profit/loss / Market Cap
But here, the Unrealized profit/loss is given by
Market Cap - Realized Cap
Therefore, Relative unrealized profit/loss (RUPL) is given by
(Market Cap - Realized Cap) / Market Cap
Hence, with just the market cap and the realized Cap, we can calculate the relative unrealized profit/loss.
Example
Assuming Litecoin, a UTXO crypto has just 2 UTXOs in circulation, denoted as LTC-X and LTC-Y each representing 1 LTC, each representing 1 LTC. LTC-X was last moved for $147 while LTC-Y was last moved for $150. The current price of LTC is $167. What is the Relative Unrealized profit/loss (RUPL)?
Solution
Circulating supply of LTC = 2
Current Price of LTC = $167
Market Cap = $167 x 2 = $334
Realized Cap of LTC = $147 + $150 = $297
Therefore, Relative unrealized profit/loss (RUPL) is given by
(334 - 297) / 334 = 0.1108 or 11.08%
SPENT OUTPUT PROFIT/LOSS (SOPR)
Spent output price ratio shows the local tops and bottoms in a cycle. Whereas RUPL is better suited for cycle tops and bottoms. It's a ratio of the current price at which the UTXO can be sold to the last price at which the UTXO was sold.
Spent output price ratio (SOPR) is given by
Price sold / Price paid
To get a concise understanding of the SOPR, let's use the example for RUPL to calculate SOPR.
Example
Assume Litecoin, a UTXO crypto has just 2 UTXOs in circulation, denoted as LTC-X and LTC-Y, each representing 1 LTC. LTC-X was last moved for $147 while LTC-Y was last moved for $150. The current price of LTC is $167. What is the Spent Output Price Ratio (SOPR) if they're all sold now?
Solution
Price paid for UTXOs = $147 + $150 = $297
Price sold of UTXOs = $167 x 2 = $334
Spent output price ratio (SOPR) is given by
Note: When SOPR is greater than 1, it signifies profit. When it's less than 1, it signifies loss.
HOW RUPL AND SOPR DIFFER FROM MVRV RATIO
They are all ratios technically but of different parameters.
RUPL is the ratio of the difference between the Market Cap and Realized Cap to the Market Cap all of the same period.
SOPR is the ratio of the most recent Realized Cap to its previous Realized Cap
MVRV is a ratio of the Market Cap to the Realized Cap of the same period.
Q.2. Consider the on-chain metrics-- Relative Unrealized Profit/Loss & SOPR, from any reliable source(Santiment, Glassnode, LookintoBitcoin, Coinmetrics, etc), and create a fundamental analysis model for any UTXO based crypto, e.g. BTC, LTC [create a model to identify the cycle top & bottom and/or local top & bottom] and determine the price trend/predict the market (or correlate the data with the price trend)w.r.t. the on-chain metrics? Examples/Analysis/Screenshot?
I would have loved to consider LTC but finding data on the RUPL metrics for LTC was futile, though I was able to access data on the SOPR metric for LTC. I chose BTC instead as I found data on RUPL metrics for BTC courtesy of Look Into Bitcoin, and I also found data on SOPR
for BTC courtesy of glassnode.
Relative Unrealized Profit/Loss (RUPL)
Before using the Relative Unrealized Profit/Loss (RUPL) metrics, there are a few important points to understand.
Whenever the RUPL goes above 0.75 or 75%, it's an indication that the price is very close to reaching a profit-taking price level. This level is called cycle top and it's the highest price level in a bullish cycle.
On the flip side, whenever the RUPL goes below 0.00 or 0% or whenever it becomes negative, it's an indication that the price is very close to a bottom or accumulation zone. This is referred to as cycle bottom and is the lowest price level in a bearish cycle.
When it's between 0.00 and 0.75 (or 0% and 75%), RUPL is indicating either a bearish or bullish cycle. You can validate the cycle with the historic RUPL range.
If you divide the price levels into different stages, with RUPL, we can tell what each stage represents.
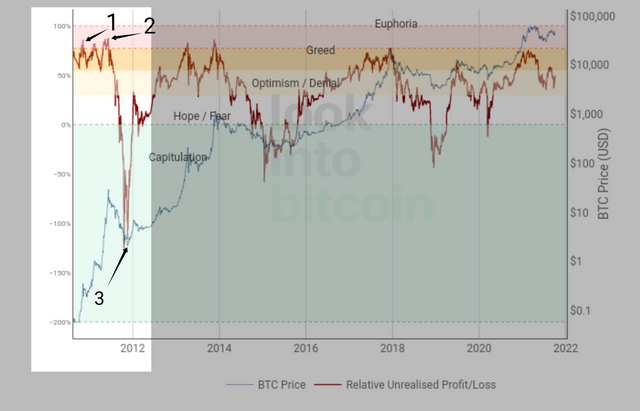
Now, let's consider RUPL for BTC over 1 year (Oct. 5, 2010 - Nov. 18, 2012)

Credit
Observation
On Oct. 25, 2010 (arrow 1), the RUPL was up 78% and BTC price was $0.15. Now at 78% we're staring at a high point but can we tell if it's a local top or cycle top? At this point, a combination of indicators will help.
Two days later, on Oct. 27, 2010, the RUPL was 80% and BTC price was $0.18. This was an indication that the price was headed to a take-profit level or cycle top if it wasn't actually there already.
The RUPL didn't rise higher after that day, it began going down in the coming months. Though it came back up, it couldn't reach 80%. On April 5, 2011, it fell as low as 53%.
All this while, BTC price kept breaking its own highs and the bull run continued. Mind you, RUPL was higher than 50% all this while. At least, those who decided to HODL when RUPL was 78 % and 80% when BTC price was at $0.15 and $0.18 respectively, would have been rewarded with more profits even after the RUPL fell to 53% because BTC price then was $0.67.
BTC was still bullish and HODLERS would be encouraged to hold somewhat as they saw $0.67 read 53% on RUPL, whereas $0.15 read 78% some 6 months ago. This meant a recalibration of price-RUPL relationship. To read 75+% again, BTC price will have to do better than $0.67. And since BTC price has surpassed what it was at 78% RUPL, it was clear that the BTC price at 78% was not the cycle top.
On Jun 08, 2011 (arrow 2), RUPL was up 88% and BTC price was about $27.5. Only optimism, lost keys and cluelessness would keep BTC in any wallet at that time. You don't need to tell if this was the cycle top or not, it has been bullish for about 7 months, prices would soon collapse.
From 88% RUPL began to slip and till Nov. 2011 it was going down. On Nov. 18, 2011 (arrow 3), BTC was $2.14 and RUPL was -115% terribly bearish 🐻.
At this point, RUPL had slipped below zero and a bottom was later formed.
Throughout this period under observation, whenever you see the RUPL goes above 75%, it's followed shortly by a correction or a bearish reversal. Whenever it goes significantly below zero, there's also a bullish reversal, thus above 75% is considered the take profit zone and below 0% is considered the accumulation/bottom zzone.
Analysis
The above Observation was for the early days of BTC and spanned 1 year. We saw the RUPL read above 75% on different occasions. Determining which of them was the cycle top as at then, would have required a prophet. But when we look at the price evolution that period, we see some vital signals.
- RUPL did not exceed it's high of 80% for some time, but price exceeded it's level at 80% RUPL which was $0.18. this means higher prices didn't equate higher RUPL. WHY?
Reason
RUPL is a function of Market Cap and Realized Cap. Recall, Relative unrealized profit/loss (RUPL) is given by
(Market Cap - Realized Cap) / Market Cap
In a bull run, some holders will take profit and this will increase the value of the Realized Cap. When the increase in Realized Cap is more than that of the Market Cap, the difference between Market Cap and Realized Cap reduces and the RUPL overall reduces. So if price increases and more UTXO are moved, RUPL may not increase as much.
When the RUPL goes above 75%, there's always a top formed. This top may not be the cycle's highest but a top will definitely be formed. This also indicates that if the top is not the highest, there's going to be a high pretty soon.
The opposite of top is bottom. Whenever the RUPL goes below 0% it's bearish. A cycle bottom is about to be formed. It could also be an accumulation zone. When RUPL falls and gets below zero, it's a sign up of bearish 🐻 trend.
Prediction

Credit
The RUPL gives an insight into the stage at which the price of the UTXO is. When the RUPL is above 75% it indicates an approach to the cycle top, if it is below 0% it indicates a bottom/accumulation zone.
From the image above the RUPL is currently at 49% and price at $49,290.00. It's bullish as we can see from the year's price trend. The current level of the RUPL seems to be a recovery from a recent downward trend but the price could still go anywhere from here.
Price-RUPL relationship as can be seen on the chart image above has be recalibrated over the years and that's a logarithmic graph by the way. After December 2017, RUPL hasn't gone above 75% but prices have soared above the ATH of $19.3k formed that period and even reached $64k which is over 3x more than the last ATH reached when RUPL last went above 75%.
Though RUPL have been unable to go above 75% for close to 3 years, BTC price reached an ATH of $64k with a RUPL of 75%. Though currently 49%, if the RUPL gets back to the high point of 75%, BTC might break it's ATH but if it goes back down, it will require a slump to the negative zone to form a bear market at the current Price-RUPL relationship on this chart.
Spent Output Price Ratio (SOPR)
In using the Spent Output Price Ratio (SOPR) there are few point to take not of.
When it moves significantly above 1, a local top is formed.
When it moves significantly below 1, a local bottom is formed.
In a bull cycle, when the SOPR approaches 1 or is slightly above 1, it indicates a buy opportunity.
In a bear cycle, when the SOPR approaches 1, it indicates a sell opportunity.
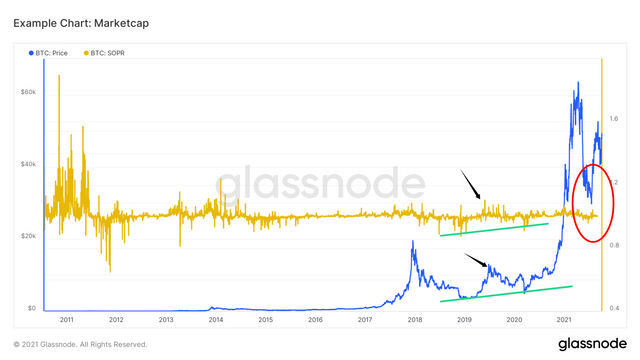
Now let's consider SOPR for BTC from 2019 - 2021.

Credit - My glassnode.com account.
Observation/Analysis
From the image above, we see that local tops are usually preceded by an upward spike in SOPR. In 2019, we can see 2 black arrows highlighting this. The top came just after there had been a spike in SOPR. Also the SOPR at that time was significantly above 1.
We also see a downward spike formed just below a local bottom along the green lines. In the red circle, we see a series of local bottoms and also a series of downward spike on the SOPR.
As at Sep. 03, 2021, the SOPR is 1.003827. It's around 1 and so it was a buy signal and a top was also formed very shortly after. BTC then was $50k.
Prediction
With a buy signal just over a month ago around $50k, and a local top then, we can expect price to surge even higher in the coming months. I'm unable to get a SOPR for October but after the buy signal at $50k and local top at $52k, prices slumped to $40k and returned to $50k on Oct. 05. This shows that there's still a possibility that the buy signal at $50k one month ago was right.
My prediction is BTC will go up in the coming months, based on the buy signal given on Sept. 03 at $50k which is yet to yield significant profit as BTC is yet to significantly exceed the $50k mark barring the local top of $52k.
Q.3. Write down the specific use of Relative Unrealized Profit/Loss(RUPL), SOPR, and MVRV in the context of identifying top & bottom?
RUPL, SOPR and MVRV are onchain metrics best suited for long term analysis for UTXO assets. All three utilizes the realized values of UTXO assets to create their indications.
RUPL can be used to identify cycle tops and bottoms
SOPR can be used to identify local tops and bottoms
MVRV is combined with any of the two to confirm/optimize their indications/signals.
CONCLUSION
Onchain metrics analysis is a very important analysis for UTXO assets. It tells you the exact activity, void of any sentiment, happening in the asset's markets.
Relative Unrealized Profit/Loss (RUPL) is one of such metric and can be used to identify a historic high point or cycle high as well as a historic low point or cycle low. Spent Output Price Ratio (SOPR) is another onchain metrics and is used to identify local tops and bottoms.
Thanks for reading.
Cc:
@sapwood

