Chaikin Money Flow Indicator - Crypto Academy / S4W6 - Homework Post for @kouba01

Q.1. In your own words, give a simplified explanation of the CMF indicator with an example of how to calculate its value?
The Chaikin Money Flow (CMF) indicator is a technical analysis indicator that measure the pressure at which traders are buying and selling a crypto asset. This indicator is closely connect to the volume of cash or money flow of the crypto asset. It measures the Money Flow Volume of the asset over a given period of time.
This indicator functions as an oscillator, ranging between 1 and -1. Thus, it finds application in measuring the changes in the pressure at which a crypto asset is bought and sold. Like many oscillator indicators, the Chaikin Money Flow (CMF) indicator is also a leading indicator, meaning that it can help to predict future changes and by so doing, help to predict future market opportunities.
HOW DOES THE CMF INDICATOR WORK?
The Money Flow Volume measures the pressure of buying and selling of an asset for a given period. It does this through the help of the Money Flow Multiplier.
The Money Flow Multiplier measures the closing price of the asset for a given period, against the price range for that same period.
If the price closed in the upper half of the price range then buying pressure is higher than the selling pressure.
If the price closed in the lower half of the price range then the selling pressure is higher than the buying pressure.
The product of the Money Flow Multiplier and the asset volume for a given period gives the Money Flow Volume for that period.
The CMF then adds up the Money Flow Volume for a user defined look back period and divides it by the period volume for that look back period.
The CMF oscillates between 1 and -1. When it's closer to 1, it means that the buying pressure is higher than the selling pressure. When it's closer to -1, it means the selling pressure is higher than the buying pressure.
HOW TO CALCULATE CMF INDICATOR VALUE
To calculate the CMF indicator value, you need to select a look back period. For this example, I'll select 20 look back periods.
To find the CMF for the 20th period,
First, you need to find the Money Flow Multiplier (MFM) for each period. MFM can be found using this price relation
MFM = [(Close - Low) - (High - Close)]/(High - Low)
When you've got the MFM for each of the 20 periods then you calculate the Money Flow Volume (MFV) for each period. You'll need the trade volume for each period to do this. The MFV for each period is given by this relation,
MFV = MFM x Trade Volume
After calculating the MFV for each of the 20 periods, then you Calculate the CMF for the last period. The CMF of the last period is given by the total MFV and the total Volume of the 20 periods through the relation
CMF = Total MFV /Total Volume
With that, you can calculate the value of of the CMF for a given period.
Q.2. Demonstrate how to add the indicator to the chart on a platform other than the tradingview, highlighting how to modify the settings of the period(best setting).(screenshot required)
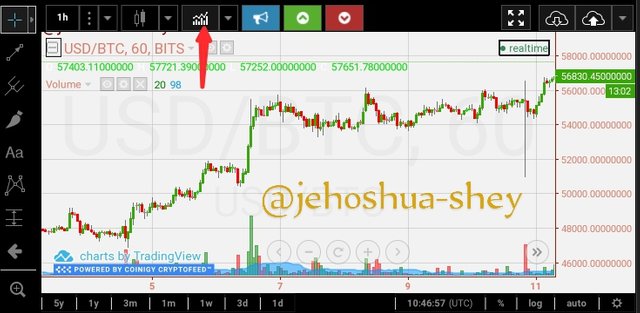
To demonstrate adding the Chaikin Money Flow indicator, I decided to use one of the Tradingview alternatives. This platform is called Coinigy.
Here's how to set up the Chaikin Money Flow indicator on Coinigy.
- To access the charts on this platform, simply sign up for a free account with your email, then login to your email and activate the account. Once that is done, login to see the chart area.
- On the chart area, click on the indicator icon as shown below
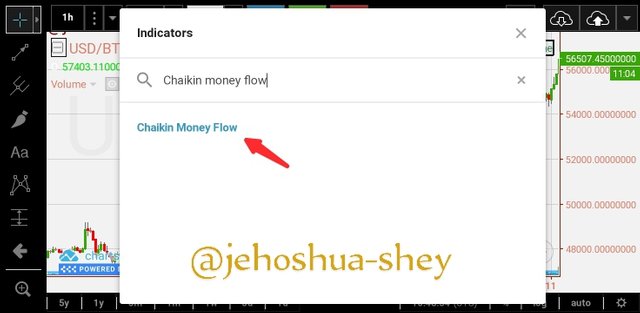
- Next, on the search area search for 'Chaikin Money Flow' and click on the option shown
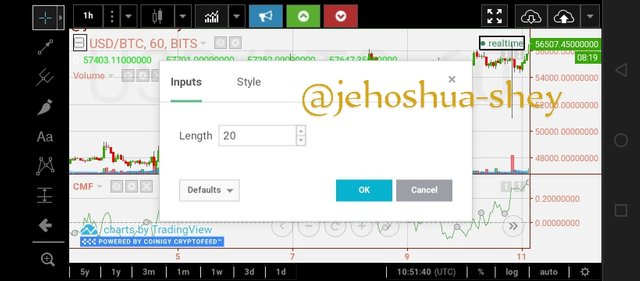
- The indicator appears below the Volume indicator on the chart. It is pointed with a green arrow in the image below. To set the CMF indicator, click on the settings icon (pointed with a red arrow in the image below)
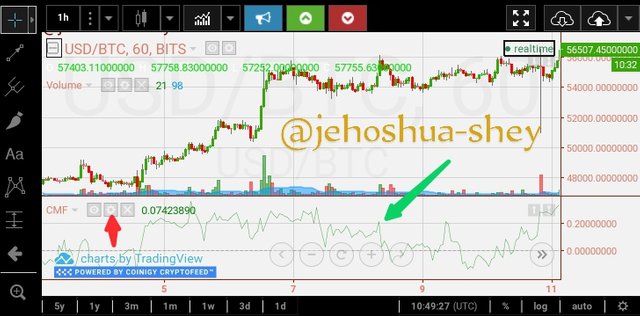
- The settings has two sections - Input and Style. In the input part, you can set up the look back period. Here, I'm going with 20 periods. 20 is also the default period on Coinigy.
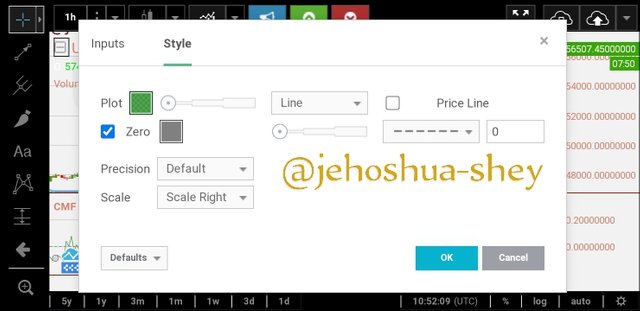
- In the style section, you can modify the appearance of your CMF indicator.
Q.3. What is the indicator’s role in confirming the direction of trend and determining entry and exit points (buy/sell)?(screenshot required)
As has been stated earlier, the Chaikin Money Flow measures buying and selling pressure over a given/set time. This indicator also oscillates between 1 and -1. Whenever it's close to 1 or in the positive zone, it signifies buying pressure but when it's close to -1 or in the negative zone, it signifies selling pressure.
CONFIRMING UPTREND WITH CMF
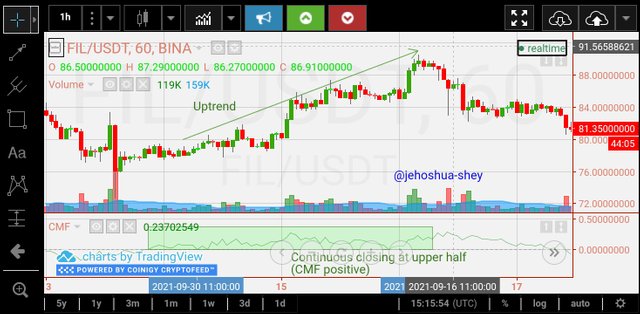
If the price movement is in an uptrend, a reading close to 1 or in the positive zone will confirm the uptrend as it signifies buying pressure and buying pressure pushes the price upwards.
However, if the price movement is in an uptrend, and the CMF reads close to -1 or in the negative zone, then the CMF questions the price uptrend as it signifies a selling pressure in an uptrend.
CONFIRMING DOWNTREND WITH CMF
If the price movement is in a dowmtrend, and the CMF reads close to -1 or in the negative zone, then the CMF confirms the price downtrend as it signifies a selling pressure and selling pressure pushes the price downwards

However, If the price movement is in a downtrend, a reading close to 1 or in the positive zone will question the downtrend as it signifies buying pressure and buying pressure pushes the price upwards. This scenario is questionable in a downtrend.
DETERMINING ENTRY AND EXITPOINTS
The Chaikin Money Flow indicator is a measure of closing prices against price range. When the price closed at the upper half of the price range for the same period, we say there's buying pressure and buying pressure implies that accumulation is ongoing for the asset.
Conversely, when the price closed at the lower half of the price range for the same period, we say there's selling pressure and selling pressure implies that distribution is ongoing for the asset.
The closer the closing price to the highest range, the more the buying pressure and the more the accumulation. If this continues for consecutive periods, then the CMF will be positive.
On the other hand, the closer the closing price to the lowest range, the more the selling pressure and the more the distribution. If this continues for consecutive periods, then CMF will be negative.
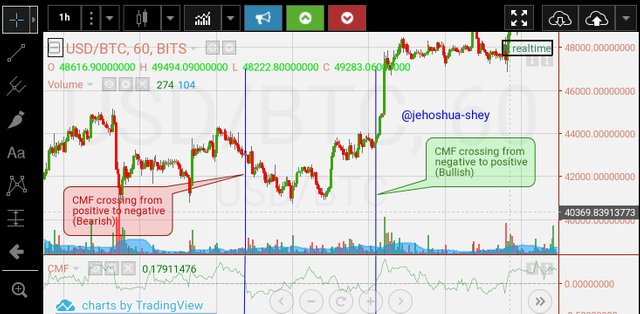
When CMF changes from negative to positive or crosses the neutral line from the negative zone to the positive zone, it shows a bullish sign.
Conversely, when the CMF changes from positive to negative or crosses the neutral line from the positive zone to the negative zone, it shows a bearish sign
Q.4. Trade with a crossover signal between the CMF and wider lines such as +/- 0.1 or +/- 0.15 or it can also be +/- 0.2, identify the most important signals that can be extracted using several examples. (screenshot required)
Below are the descriptions of two demo trades performed with a crossover signal between the CMF and the +/- 0.2 wider line. The first is a buy trade while the second is a sell trade.
Both trades were done with an ETH/BUSD H1 chart.
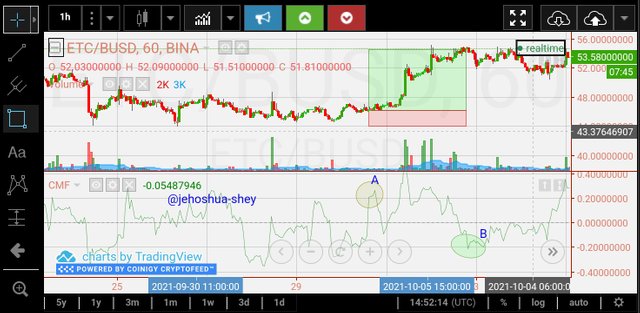
BUY TRADE WITH +/- 0.2 WIDER LINE
For the buy trade, I observed the rise of the CMF indicator from below the -0.2 line, then above the neutral line (0 line) before crossing above the 0.2 line. The price at the point it crossed the 0.2 line was my entry point.
For my stoploss, I set it a little below the most recent low and exited with my take profit at the next point where the CMF crossed below the -0.2 line again.
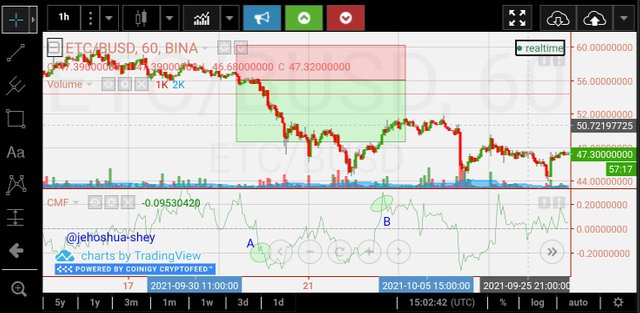
SELL TRADE WITH +/- 0.2 WIDER LINE
For the sell trade, I observed the fall of the CMF indicator from above the 0.2 line, then below the neutral line (0 line) before crossing below the -0.2 line. The price at the point it crossed the 0.2 line was my entry point.
For my stoploss, I set it a little above the most recent high and exited with my take profit at the next point where the CMF crossed above the 0.2 line again.
The crossovers above and below the wider +/- 0.2 line are the most important signals in this strategy.
Q.5. How to trade with divergence between the CMF and the price line? Does this trading strategy produce false signals?(screenshot required))
Just like most oscillator indicators, the occurrence of divergence still exists for the Chaikin Money Flow indicator.
Divergence is an occurrence where the price movement forms a higher high but the oscillator indicator forms a lower high in the same period or when the price movement forms a lower low but the oscillator indicator forms a higher low in the same period.
When the Chaikin Money Flow indicator forms a lower high and the price movement forms a higher high, it implies a weakness in the uptrend and a possible reversal to the downtrend. This is referred to as a bearish divergence.
When the Chaikin Money Flow indicator forms a higher low and the price movement forms a lower low, it implies a weakness in the downtrend and a possible reversal to the uptrend. This is referred to as a bullish divergence.
TRADING DIVERGENCE BETWEEN THE CMF AND THE PRICE LINE
There's no preset rule for trading this divergence. To trade divergence between CMF and price line, one has to study the market structure or employ other technical indicators or strategies.
Here's a sample of a buy trade involving a bearish divergence between the CMF and price line.
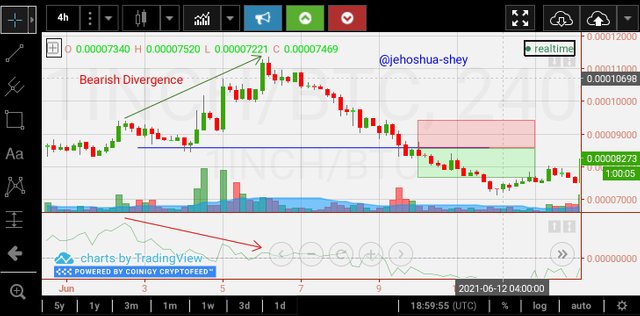
Although this was a bearish divergence between CMF and price line, I traded it using the market structure break.
My entry point was at the next red candle after the price breakout in the downtrend. My stoploss was at the price level of the previous high while my take profit was in a 1:1 ratio with my stoploss.
DOES THIS TRADING STRATEGY GIVE FALSE SIGNALS?
Yes, it gives false signals, it is not always correct. Sometimes it gives a divergence and leaves you with no clear market structure and even end up in the previous trend. If a trader doesn't employ other indicators and technical analysis, they could end up getting stuck after making entries or hitting their stoploss very early.
Below is an example of a false signal. There was a divergence but it was not followed by any clear structure or reversal. The price ended up continuing in it's previous direction.
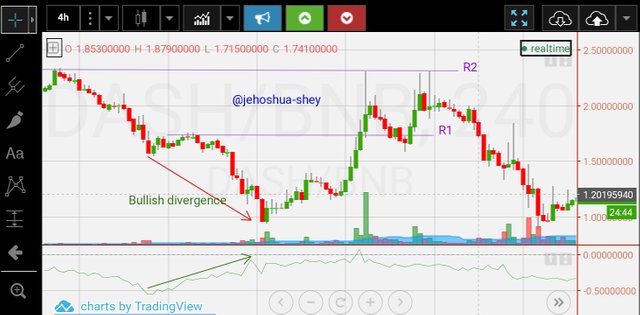
This was supposed to mean that there was a buying pressure amidst a downtrend but that did not result in a bullish reversal. It seemed like it was merely a correction.
The price broke above a minor resistance at R1 but never crossed the major resistance level of R2.
CONCLUSION
The Chaikin Money Flow indicator is a very important indicator as it can be used in confirming trends and when combined with other technical indicators or strategies, can be used to predict market reversals. This indicator classifies as an oscillator as it shuttles between 1 and -1.
Just like other oscillator indicators, the Chaikin Money Flow indicator produces divergence with the price line although it is best not to trade solely on its divergence with the price line.
For trading, the Chaikin Money Flow indicator gives us a more comprehensive strategy with the wider lines where the crossovers are really important signals. This is quite reliable though it's always preferred to combine indicators.
Thanks for reading.
Cc:
@kouba01
Hello @jehoshua-shey,
Thank you for participating in the 6th Week Crypto Course in its 4th season and for your efforts to complete the suggested tasks, you deserve a Total|6/10 rating, according to the following scale:
My review :
Work with acceptable content. It was possible to go deeper into the ideas presented and provide several examples. Here are some notes that I bring to you.
You did not answer why you chose this setting.
As for the fourth question, you did not delve into the analysis of the most important signals resulting from the crossover and the most important decisions that a trader can take.
Thanks again for your effort, and we look forward to reading your next work.
Sincerely,@kouba01
Congratulations! Your post has been selected as a daily Steemit truffle! It is listed on rank 25 of all contributions awarded today. You can find the TOP DAILY TRUFFLE PICKS HERE.
I upvoted your contribution because to my mind your post is at least 7 SBD worth and should receive 29 votes. It's now up to the lovely Steemit community to make this come true.
I am
TrufflePig, an Artificial Intelligence Bot that helps minnows and content curators using Machine Learning. If you are curious how I select content, you can find an explanation here!Have a nice day and sincerely yours,

TrufflePig