Trading using Fibonacci Retracement Levels .
Hello my @everyone it is me your favorite Steemit friend @jasminemary. I am excited to have you here on this post which I have discussed Fibonacci Retracement as a technical analysis tool as organized in the SteemitCryptoAcademy community.
Explain the concept of Fibonacci retracement as a technical analysis tool and how it is applied in crypto markets.
Fibonacci retracement is one of the best technical tools that crypto traders use to confirm their entry point, loss, and profit point in the crypto market.
In a simple understanding, Fibonacci retracement is a line that is horizontally drawn which shows how support level and resistance level can likely occur (happen). Fibonacci retracement tool levels are connected with percentage (%) that indicates, how far a previous move of how the price of crypto has retraced.
Normally, the levels of the Fibonacci retracement start with 23.6%, and continue down to 78.6%. Drawing of the Fibonacci retracement tools starts from the current highs to the current lows which are represented in percentages as we have previously stated.
Traders usually place their entry position in the crypto market using Fibonacci retracement tools when the price has reversed during a retracement at the support or the resistance levels.
Fibonacci retracements tool has become a popular technical analysis tool in the crypto market that is used by crypto traders to identify the potential areas of support level and resistance level which as a crypto trader helps you to know where the price of STEEM/USDT, BTC/USDT or whatever crypto you are analyzing may reverse from.
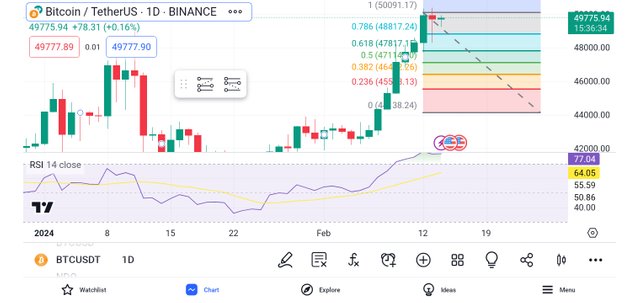
Now as a crypto trader that wants to use Fibonacci retracements as a technical analysis tool on the BTC/USDT pair, you will need to add FIB on the chart of BTC/USDT and begin to select the extreme high and low levels in and Uptrend and as well Downtrend.
Observe the price action of BTC/USDT at these key levels 38.2%, 50%, and 61.8% which are the levels at which you can see a reversal in the market. In this case, if you want to draw your support level, you have to begin from the swing low to the second swing high and take it upward.
As for the drawing of resistance levels, you have to begin from the swing high to the second swing low and take it downward.
Utilize Tradingview to illustrate Fibonacci retracement levels on the BTC/USDT, ETH/USDT, and STEEM/USDT pairs. (Include screenshots to showcase retracement levels during both uptrends and downtrends).
| BTC/USDT |
|---|
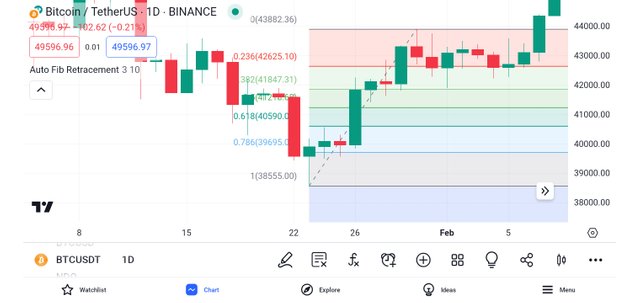
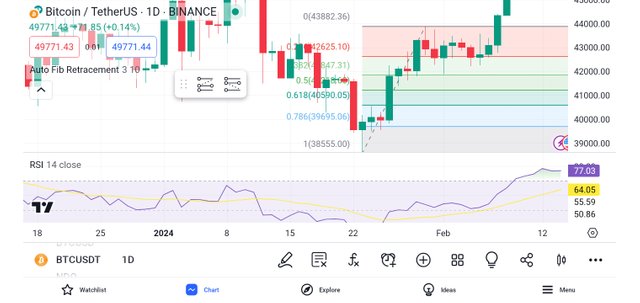
Looking at the chart of the BTC/USDT pair in the 1-day timeframe, we can see that I have identified a reversal level following price retracement at the time the BTC/USDT was in an uptrend.
On the chart again we can see that the Fibonacci retracement tools were drawn starting from the current high price of 0(43882.36) down to the current low price of 1(3855.00). As for the support and resistance levels, from the chart, we can see that the support level is at $3855.00 which stands as the key level of Fibonacci retracement tools.
| ETH/USDT |
|---|
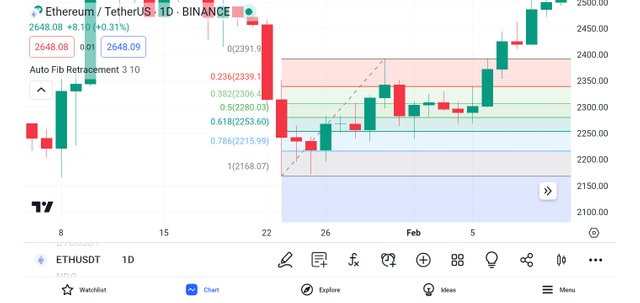
On the chart of ETH/USDT, we can see that the Fibonacci retracement tools were drawn starting from the current high price of 0(2391.9) down to the current low price of 1(2168.06). As for the support and resistance levels, from the chart, we can see that the support level is at $2168.06 which stands as the key level of Fibonacci retracement tools.
| STEEM/USDT |
|---|
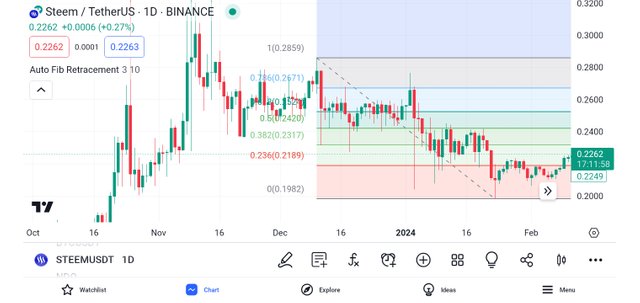
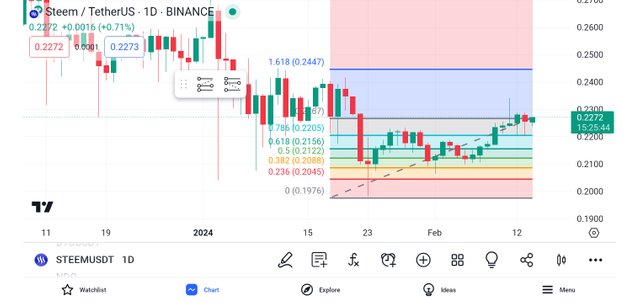
Looking at the chart of the STEEM/USDT pair in the 1-day timeframe, we can see that I have identified a reversal level following price retracement at the time the STEEM/USDT was in an uptrend.
On the chart again we can see that the Fibonacci retracement tools were drawn starting from the current high price 1(0.2859) down to the current low price 0(0.1982). As for the support and resistance levels, from the chart, we can see that the support level is at $0.1982 which stands as the key level of Fibonacci retracement tools.
Break down the significance of key Fibonacci levels (e.g., 0.382, 0.500, 0.618) and explain how traders interpret these levels for potential support and resistance areas.
Fibonacci levels are percentages (%) that are derived from the golden ratio the most widely levels that traders use to interpret the crypto market are 0.382, 0.500, and 0.618.
These three levels are the levels that represent potential support and resistance areas where the price of cryptos such as BTC/USDT, ETH/USDT, STEEM/USDT, and other cryptos might like to reverse or bounce back during a trend move.
Crypto traders use these key levels in identifying the potential areas where the price of the asset they are trading might reverse so they can make informed trading decisions about when to enter the market or exit the market.
Explore the synergy of Fibonacci retracement with other technical indicators (e.g., Moving Averages, RSI). Discuss how a combination of tools can provide a more robust analysis.
| Combining Fibonacci Retracement with RSI |
|---|
As a trader when you apply an FIB chart, you will develop the mindset of setting your order at the most significant levels and go on with your other activities for the day.
When it comes to using Fibonacci Retracement the guarantee of the asset to remain in one area isn't certain which is why you have to combine it with other indicators like RSI to know where the area will move to.
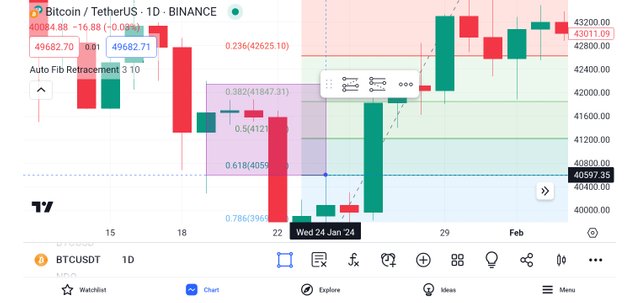
For instance, you could look for the Fibonacci retracement to line up with a horizontal support level and resistance level or a trendline which using the relative strength index can help you to whether the trend is due for reversal or is still weakening.
Now combining the Fibonacci retracement with the relative strength index will help us to identify our divergences that indicate a potential reversal as the price of Bitcoin moves to the Fibonacci level.
To this our entry price can be at the time the divergences happened at a significant fib level or when the price of Bitcoin has shown signs of retracement.
We can place our stop loss below or above the entry candle based on the direction of the market, whereas our take profit and be placed at the low or high of the plotted retracement.
Specifically, analyze the recent price action of STEEM/USDT using Fibonacci retracement.
| STEEM/USDT |
|---|
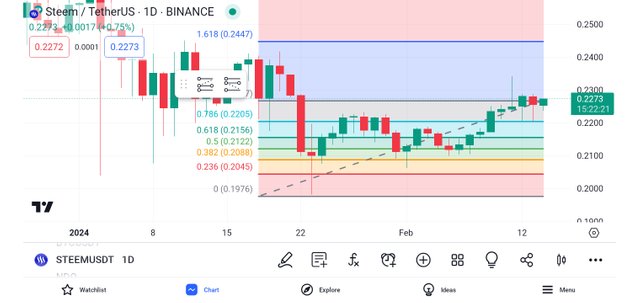
At the time of analyzing the recent price action of STEEM/USDT using Fibonacci Retracement, the current price of STEEM/USDT was at $0.227 if the price should retrace back it will retrace to the Fibonacci level of 0.618 and if the level is broken it will move down to Fibonacci level of 0.5.
If the Fibonacci level of 0.5 is also broken down it will move to 0.382 Fibonacci level and if the level is also broken it will move down to 0.236 Fibonacci level and so on till it gets to the last Fibonacci level.
Fibonacci retracement is a powerful technical Indicator tool that is used by traders to determine and confirm their entry and exit points in the crypto market Fibonacci extension, is used to determine the target price which is where the price of cryptocurrency is moving to next which we have learned in this post using different crypto pairs.
I am inviting: @ngoenyi, @sahmie, and @daprado1999

Hello dear, greetings to you. I hope you are enjoying the sweet moments of your life.
Fibonacci retracement is a line that is horizontally drawn which shows how support level and resistance level can likely occur (happen). Yes I completely agree to you here. It gives us the best retracement levels. The most important of them are the golden level of Fibonacci.
We call 0.38, 0.5 and 0.61 the most important Fibonacci levels and these are the golden levels too. Often these are the levels the price get retracement from. If we see the price near this range we can surely go for long or short Position, according to the trend.
Using of Fibonacci with RSI will give us more confirmation. Yes that's true. I use too many other tools too along with Fibonacci. MCAD, RSI and trend line, I use all of these. That's true we should use tools in combination and not alone. Many confirmation from other tools make our trade more accurate and less risky.
Wish you best of luck in the contest, keep blessing.
Thank you plaintiful for your good support and nicely comments.
TEAM 5
Congratulations! Your post has been upvoted through steemcurator08.Thank you for the support dear.
Hello @jasminemary Your comprehensive explanation of Fibonacci retracement is invaluable for crypto traders. Breaking down the levels and demonstrating their application on BTC/USDT ETH/USDT and STEEM/USDT pairs with Tradingview screenshots add clarity. The synergy of Fibonacci retracement with RSI is a strategic insight. Your detailed analysis of STEEM/USDTs recent price action using Fibonacci retracement provides a practical example. Best wishes
Thank you for finding my post useful.
Great post dear @jasminemary! Your detailed explanation of Fibonacci retracement as a technical analysis tool in the crypto market is very informative. I appreciate how you've provided clear instructions on how to use Fibonacci retracement on different crypto pairs, along with screenshots for illustration. Keep up the excellent work...
Thank you friend for your good support here.
Thank you, friend!


I'm @steem.history, who is steem witness.
Thank you for witnessvoting for me.
please click it!
(Go to https://steemit.com/~witnesses and type fbslo at the bottom of the page)
The weight is reduced because of the lack of Voting Power. If you vote for me as a witness, you can get my little vote.
This was a great presentation of what this topic entails!
Overall, this post serves as a helpful guide for crypto traders looking to integrate Fibonacci retracements into their technical analysis toolkit.
Thank you brotherly for like what I have presented
Upvoted. Thank You for sending some of your rewards to @null. It will make Steem stronger.
Fibonacci is very well presented. You are such a tool to figure out everything very easily. The most important thing here is the great knowledge of the person who created it. Thank you very much for sharing so beautifully.
Thank you for supporting me.
you are welcome 😊
TEAM 5
Congratulations! Your post has been upvoted through steemcurator08.Thanks to you @josepha and Team 5 members.
Wow, your detailed explanation of Fibonacci retracement is absolutely priceless for crypto traders. You really went above and beyond by breaking down the levels and showing how they work on different trading pairs like BTC/USDT, ETH/USDT, and STEEM/USDT with screenshots. It's amazing how the synergy between Fibonacci retracement and RSI can provide strategic insights. And your in-depth analysis of recent price action on STEEM/USDT using Fibonacci retracement is a fantastic practical example. Sending you my best wishes.
Thank you sir, for your great support here.