Steemit Crypto Academy | Technical Indicators | Homework task for @reminiscence01
You are Welcome to My Homework Post
1. a) In your own words, explain Technical indicators and why it is a good technical analysis tool.
The words Technical Indicator is simply the study of statistical trends that is gotten from historical data, such as price, volume or open interest, that is used by traders to predict the future of market price, trends of the market and to make accurate decisions when trading. In a nutshell, technical indicator are mathematical computation that is derived historically to helps investors and traders to predicts the future occurance of market price and trends. It gives traders/investors better understanding on price movement as well as the entry and exit points of the market.
The technical Indicator is displayed graphically in a chart and compared with with price movement.The goal of the technical Indicator is to help traders in technical analysis to predict future market price as well as volume patterns, price trends, moving average, oscillators, Bollinger indicators etc. Apart from helping traders to determine price movements, it also displayed in a chart showing traders on how they can make profits from past price movement.
b) Are technical indicators good for cryptocurrency analysis? Explain your answer.
To me, technical indicators are not good for cryptocurrency analysis. They are lagging the price of cryptocurrency because of their nature and design. Although my reason for saying this is simple,which am not here to criticize all indicators of not been good for cryptocurrency analysis, because I love making use of oscillators to spot out bullish and bearish price whenever I want to enter into trade. Going by this I can easily say that technical indicators are only additional tools that are good in confirming when to enter trade and when to exit but are not good in predicting price movements, because when you depends on technical indicator for cryptocurrency analysis,you can be mislead with too many information, which can lead you to total lost of your investment.
c) Illustrate how to add indicators on the chart and also how to configure them. (Screenshot needed).
Here I will be illustrating on how to add Average Directional Index (ADX) indicator on chart and how it can be configure using the steps below:
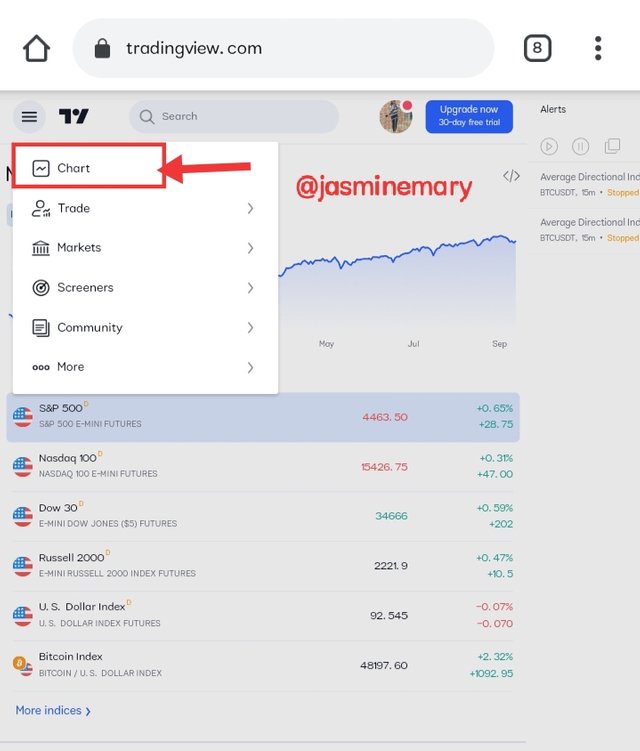
Step 1: Go to https://www.tradingview.com and click on Chart on the landing page.
 Screenshot from TradingView
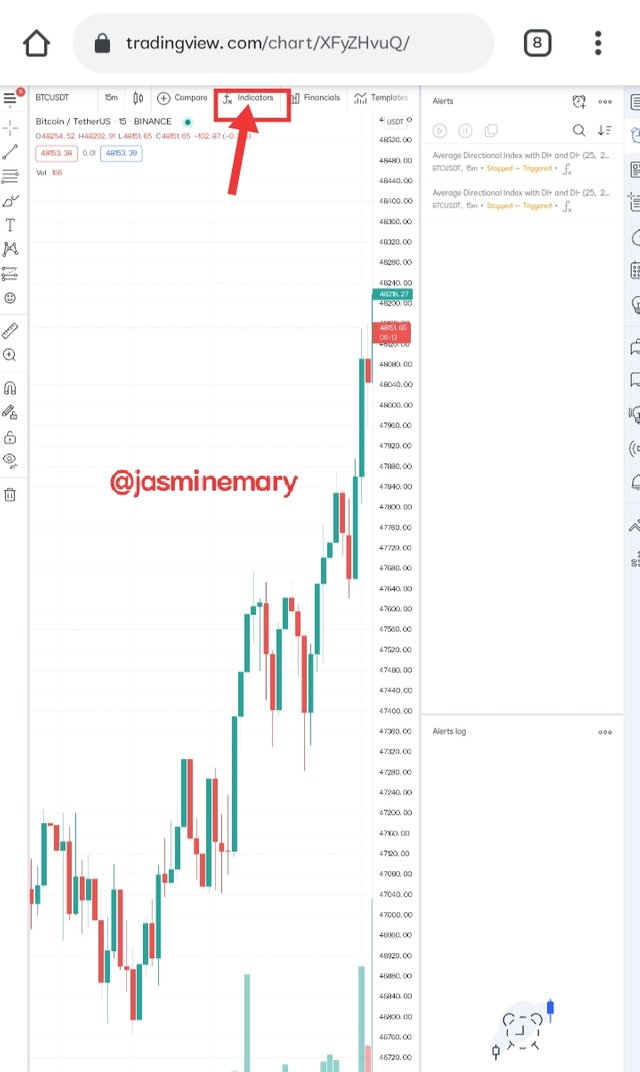
Step 2: At the TradingView chart click on fx indicator as shown below.
 Screenshot from TradingView
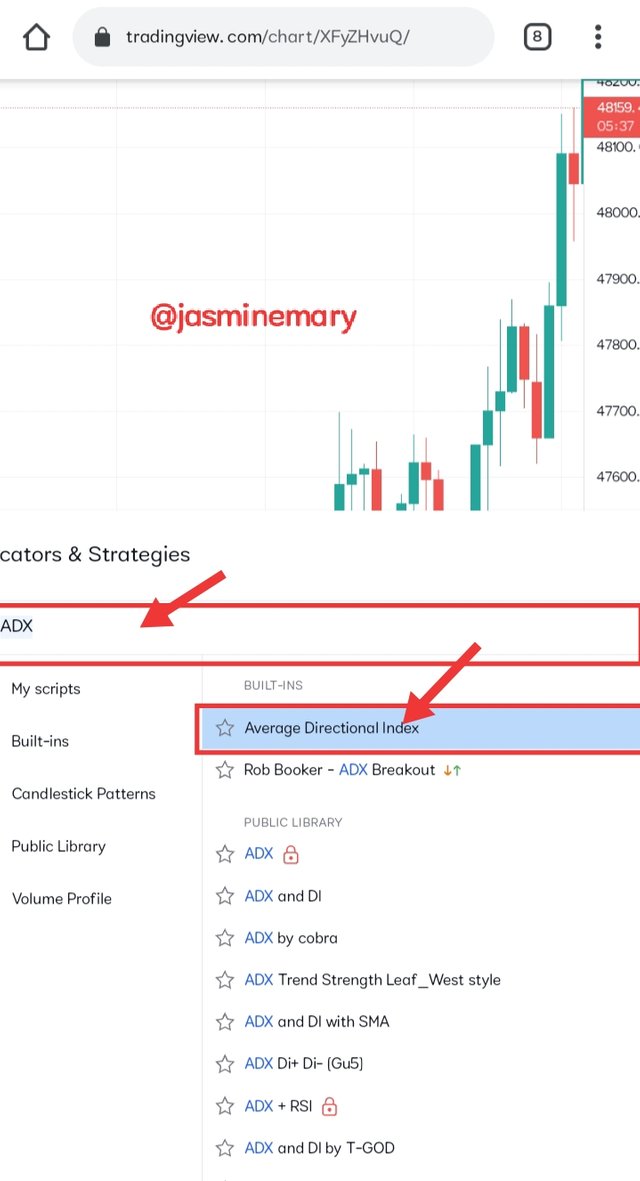
Step 3: After you have clicked on fx, go to the interface that appear on your screen and type the indicators you want to add. ( In my case I type ADX and select Average Directional Index).
 Screenshot from TradingView
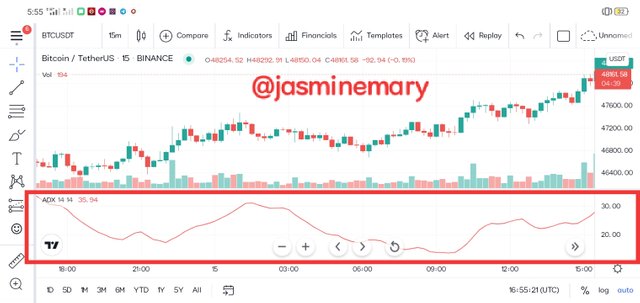
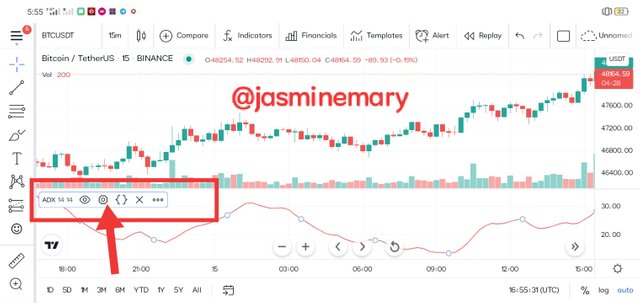
Step 4: Once you have select the indicator that have searched just as I have selected Average Directional Index, the indicator will be added to your chart as shown from the screenshot below.
 Screenshot from TradingView
In other to configure the ADX indicator, I clicked on settings in the box indicated on the screenshot below.
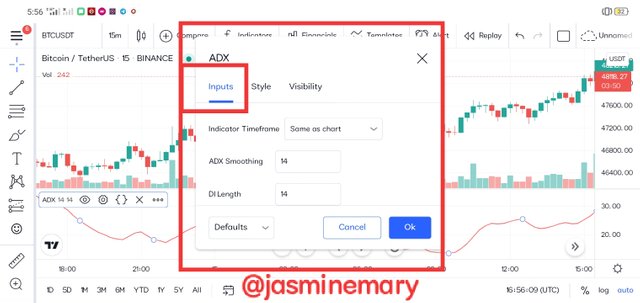
The Inputs is where I can select indicator timeframe, ADX smoothing,and DI length as shown from the screenshot below.
 ) Screenshot from TradingView
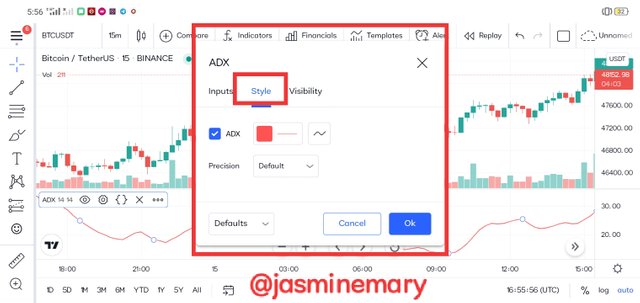
The Style settings is where we can change the color of the ADX.
 Screenshot from TradingView
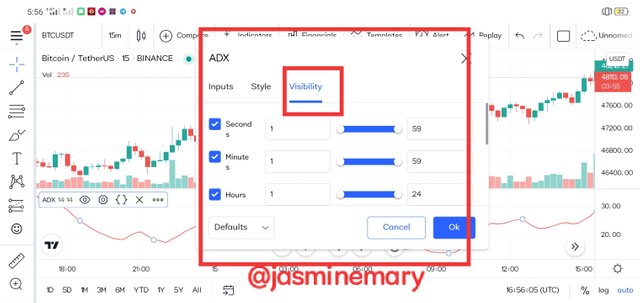
The Visibility settings is where we can select/adjust how we want the ADX to be seen on the chart.
2. a) Explain the different categories of Technical indicators and give an example of each category. Also, show the indicators used as an example on your chart. (Screenshot needed).
Trend Based Indicator:
Trend based indicator is the categories of indicator that is created to assist investors/traders to know the cytpocurrencies pairs such BTC/USDT or any other pairs that are either in uptrend or downtrend. It is the indicator that shows the direction of how price is moving in the market, that is if the price is trending or not and also if such trend really exists or not. With the help of trend based indicator or trend following indicator which are all the same, traders can be make use of the indicator to make good trading decisions as to when they're to buy or sell cryptocurrencies. Below is and example of a trend based indicator.
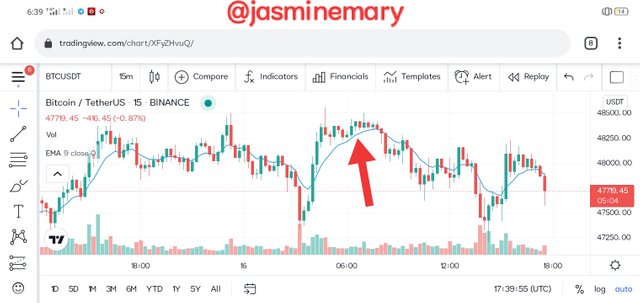
The above chart, is a Moving Averages ( Simple/Exponential) indicator on BTC/USDT pairs showing a value of 47719.45 - 416.45 (-0.87%).
Volatility Based Indicator:
Volatility based indicator, is the categories of indicator that measures the wideness of how the upswing and downswings are for a specific cryptocurrencies pars such as BTC/USDT or any other pars. Volatility is simply the state of low the price of crypto is fluctuates. Traders often used the Volatility based indicator to know how volatile a certain pair of cryptocurrencies is fluctuating before they can enter into trade to buy when the price is low and possibly sell the price is high. Bollinger Bands is a good example of such indicator that is used to ascertain the volatility of cryptocurrency pairs.
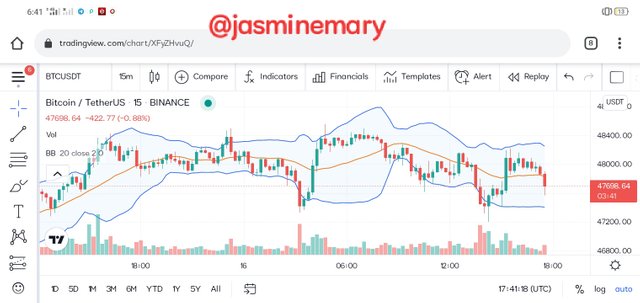
The above chart, is a Bolinger Bands, that is showing the volatility of BTC/USDT pairs on how the price is moving up and down. If you look at the chart very will you see that the Bollinger bands indicator has three (3) lines which are; the upper, lower and the middle band. The middle band is the line with 20 period moving average. The upper band and the below bands are above and below the middle bands.
Momentum-Based Indicators:
Mementum-Based indicator is a popular indicator which is also known as Oscillators Stochastic. It is the type of indicator that is based on how the market trends swing back and forth, between the minimum price and that of the maximum price of the currency. Traders use the momentum based indicator in interpreting of overbought and oversold of the price of certain cryptocurrency in the market. Traders make use of the advantages of the oscillators indicator to ascertain price reversals and when the price of an asset is to change within the period of the market.
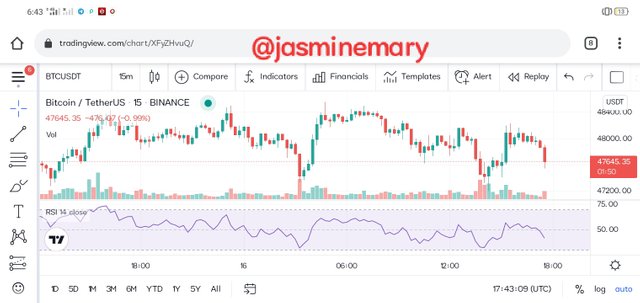
Looking at the chart above, is a Relative Strength Index (RSI) indicator that is showing the strength of the price of BTC/USDT pairs. The Relative Strength Index (RSI) is showing a value of 47645.35 - 476.07 (-0.99%)
b) Briefly explain the reason why indicators are not advisable to be used as a standalone tool for technical analysis.
Each indicator has it own unique functions and with a different purpose to why they are created. Indicator stands as a supporting tools to give traders signals concerning they investment so they can make sound decisions. Like the Inchimoku cloud indicator that provides more visual picture of how price is moving. If you have study the Inchimoku cloud indicator very well you will discovered that it signals is what help us to discover when we can possibly enter into trade or exit. Although the used of indicators is based on the choice of traders as to what the trader is looking for in the market. But if a traders can add other indicators to that which he/she feel that is best to him, it can be of advantages of his trading. For example, a trader who make used of Average Directional Index (ADX),such trader will definitely know the strength of a trend of what he is trading in the chart. Now for such a trader to know if the strength of the price of currency is moving towards positive or negative direction, the use of DM and DMI+ indicator would be included in the chart. With this I can easily say that, indicators are not advisable to be used as a standalone tool for technical analysis. Let take a look at what the ADX, DI+ and DMI indicator does when there are used together below.
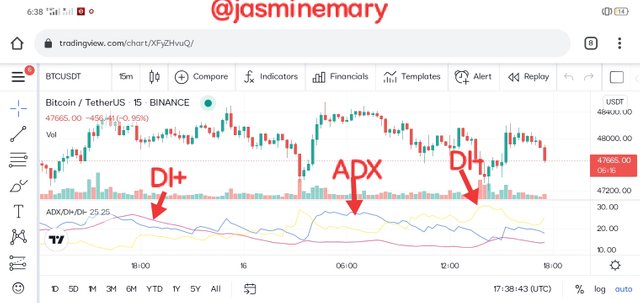
From the chart above we can see that adding DI+ and DI- to ADX indicator has given us additional information on the trading. ADX is the blue line, the orange line is the DI+ whereas the DI- is the yello lines. At the read boxes is where bearish trends is shown. If we watch clearly at the above chart we can see that the DI- lines has cross the DI+ line. To this we can now see the reasons why if we can add indicator just the we I have add DI- and DI+ to ADX indicator can help us to make better trade.
Explain How an Investor Can Increase the Success Rate of a Technical Indicator Signal
The best way an investor can increase the success rate of a technical Indicator signal is for the investor to study and understand the indicator very well in order not to go against why such indicator is being created for. Investor should only make use of the indicator that he fell can give him what he is looking for, like for an investor who want to measure that strength of the trend of price in market should make use of ADX indicator. Also configuring of indicators properly can also increase the rate of a technical indicator signal.
Another ways in which an investor can increase the success rate of technical Indicator signal is when an investor combined the right indicator together like combining of ADX, DI+ and DI- together always give right signal. There are some technical indicators that are difficult to understand when they are combined while other combinations seem very easy to understand land work with. So an investor need to be careful on the types of indicators that he is combining, and finally patient and network can also increase the indicator signal.
Conclusion
After studying the lesson of professor @reminiscence01 on technical indicator, I discovered that traders/investors really need to study and understand technical indicator before they can start using it in other not to lose they funds. Technical Indicator can help traders in so many ways like showing of historical data,so price can be easily predicted and a lot more. Good decisions can be make with the helps of technical Indicator.
Thanks for your Nobel time here.....
Best Regards;
Cc:-*
@reminiscence01