Steemit Crypto Academy Contest / S15W6 - Chartist analysis.
Hello, friends I am happy to participate in a contest organized in the SteemitCryptoAcademy community.
1.- What is chartist analysis? And the importance of chart patterns.

Chartist is what we should be looking at first before talking about chartist analysis. Chartist is a trader who believes that the price movement in cryptocurrency is not random but can be predicted with the help of studying past trends and with the use of other technical analyses.
Chartist analysis is a type of trading analysis that uses the past price movement of an asset to predict the future movements of the asset. Like for example chartist analysis is when you use the past price movement of STEEM to predict the future movements of STEEM.
Tradingview
Chartist analysis is based on the idea that the price of an asset tends to move in trends, and that these trends can be predicted, identified, and used to make profits from the market.
As a chartist trader, you can use technical Indicators and charts to identify and make good trading decisions that would help you make profits. Most traders see chartist trading as a great to make money in the financial markets of crypto, forex, and stock.
Chartist Analysis is a good way to make better decisions that will make you profit from the crypto market, but don't see it as a guarantee of becoming a successful trader.
Chartist analysis also involves you taking risks which means you must also be prepared to accept losses or profits when applying chartist analysis to crypto trading as the market is very volatile.
Using chartist analysis to identify trends in the financial markets like crypto is one of the best ways for you to make informed decision decisions in the market.
Tradingview
Since charts are visual representations of data and market activities you will be able to spot trends and patterns in the market through the tips I have shared below.
Look for a Support level and Resistance level:
Support and Resistance levels are areas where the price of the traded asset has difficulty breaking through if the price of an asset breaks through a support level or resistance level, a trend can be indicated in the market.Look for Patterns
With the chart, you can be able to spot patterns in the market such as a series of higher highs, higher lows, or a series of lower highs or lower lows.Look for the moving average and finally look for Volume which is the number of times an asset has traded in a given period. An increase in Volume means the market is gaining momentum whereas a decrease in volume means the market is losing momentum.
| THE IMPORTANCE OF CHART PATTERNS |
|---|
When it comes to the use of technical analysis, chart patterns are very important because they are used to find trends in the movement of an asset price. As a trader, it is good for you to gain knowledge in chart patterns so you can be able to identify trends and know the next move of an asset.
Another importance of chart patterns is the identification of support level and resistance level. Support is the level that shows price declines whereas support level is the level that shows price advancement.
| TYPES OF CHART PATTERNS |
|---|
Continuation and Reversal are the two types of chart patterns.
A continuation chart pattern is the type of chart pattern that identifies trades with an opportunity to continue with the trend, whereas reversal patterns are the patterns that identify where the asset stops and reversal back.
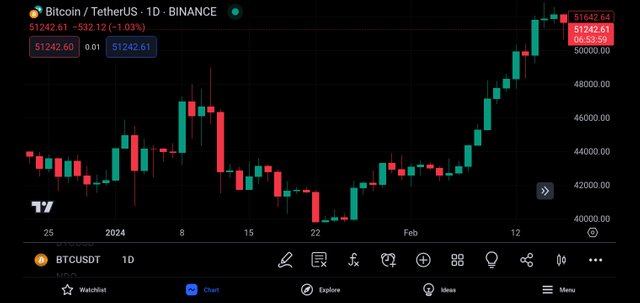
2.- What is the shoulder head shoulder pattern? Show screenshots using the BTC/USDT pair. You can use another cryptocurrency pair if you wish.
| HEAD AND SHOULDERS PATTERN |
|---|
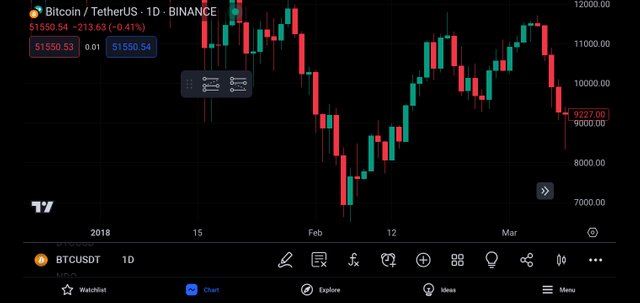
Shoulder head and shoulder patterns are also known as trend reversal information. The two are formed by a peak known as the Shoulder, followed by a higher peak known as the head, and then followed by another lower peak known as the **shoulder.
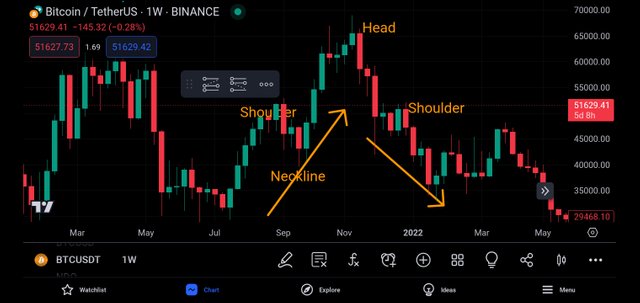
Tradingview
A "Neckline" is drawn by connecting the two lowest points and the slope of the line can either be down or up. When the slope is down, it produces a more reliable signal than when it is up.
Tradingview
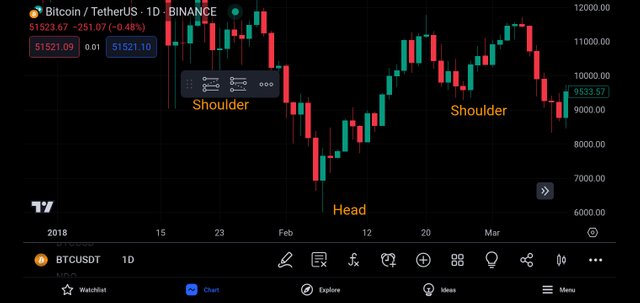
Looking at the example above we can see the shoulder head and shoulder pattern as it is drawn.
The shoulder head is the second peak and it is the highest point in the pattern. The two shoulders also don't peak but do not exceed or get closer to the height of the head.
With a formation like this, we can put an entry order below the neckline. The distance that is drawn shows how far the price will move after it breaks the neckline.
From the above chart, you can see that as the price goes below the neckline it makes a move that is at least the size of the distance between the neckline and the head.
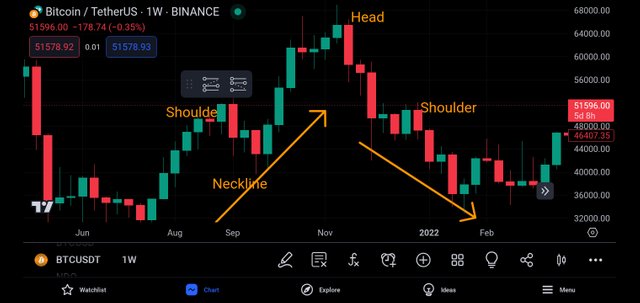
3.- Explain the formation of the inverse head-shoulders pattern. Show screenshots of a cryptocurrency pair that displays this pattern.
| INVERSE HEAD AND SHOULDERS PATTERN |
|---|
Just as it is called inverse it means something that is upside down. In the inverse head and shoulders pattern a valley is formed which is known as Shoulder, followed by an even lower valley known as the Head, and then another higher valley which is the Shoulder.
The Formation happens after extended downward movements which you can see from the chart below.
Tradingview
Looking at the chart you can see how the head and shoulders pattern is flipped upside down which with such formation we can place a buy order above the neckline.
Tradingview
The distance shows how far the asset has moved after it broke the neckline and you can see that the price of BTC/USDT moved up very well after it broke the neckline.
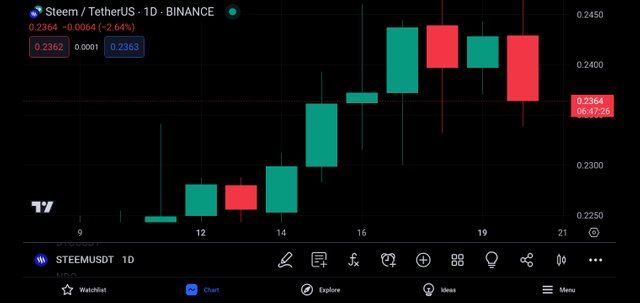
4.- For the technical analysis of the Steem, would you use chart patterns? Explain your answer
Yes, I would use chart patterns for the technical Analysis of the STEEM. STEEM is just like every other cryptocurrency which trading Steem/USDT one needs to analyze the market very.
STEEM is also in future trading pairs of Binance, Mexc, and other cryptocurrency exchanges which I would need the help of chart patterns to analyze the Steem market very well before entering or exiting the market.
Using a chart pattern I would be able to know the continuation of the price of Steem and the trend reversal. Chart pattern is very important when it comes to Identifying the levels of support and resistance which using technical analysis of the Steem, on a chart pattern would help me to make profits from the market.
I am inviting my friends; @dave-hanny, @woka-happiness, and @vickyson to also join me.
Jasmine, thanks for enhancing my knowledge. You have explained in detail about the importance of chartist analysis and the different patterns. You have shared examples of the opposite head-shoulders pattern and head-shoulders pattern using chart patterns. Congratulations
Thank you, friend!


I'm @steem.history, who is steem witness.
Thank you for witnessvoting for me.
please click it!
(Go to https://steemit.com/~witnesses and type fbslo at the bottom of the page)
The weight is reduced because of the lack of Voting Power. If you vote for me as a witness, you can get my little vote.
https://x.com/AfenMary2746/status/1759999767818518607?s=20
Your post has been successfully curated by @𝐢𝐫𝐚𝐰𝐚𝐧𝐝𝐞𝐝𝐲 at 35%.
Thanks for setting your post to 25% for @null.
We invite you to continue publishing quality content. In this way you could have the option of being selected in the weekly Top of our curation team.
The Neckline can be called the base of the head and shoulders. It works in the same way as the opposite of the two solders. If the market is in a down train, it and the Neckline are the same, and if the market is in an uptrend, it is at Neckline support.
Upvoted. Thank You for sending some of your rewards to @null. It will make Steem stronger.
Saludos cordiales hermosa amiga jasminemary, un placer para mi saludarte y leer tu participación.
Buenas respuestas, conoces el tema y la nota lo certifica,te felicito porque cada semana entregas buenas participaciones, es un gusto leerte.
Cada gráfico con un buen ejemplo de los patrones chartistas.
Feliz y bendecida tarde.
Greetings friend,
I can't thank you enough for enriching my understanding. Your detailed explanation about the significance of chartist analysis and the different patterns was truly eye-opening. The way you illustrated the opposite head-shoulders pattern and the head-shoulders pattern using chart patterns really helped me grasp the concept better. I must say, your expertise in this area is absolutely commendable. Congratulations on delivering such a fantastic explanation. Keep up the amazing work.
Thanks for reading.
You are very much welcome 🤗.
Hello my dear friend you have wrote so well and your answers are very concise and to the point and I must say you have better understanding of the Crypto Contest and you have good understanding of each topic 💝💝💝
Best of luck dear for the contest