Steemit Crypto Academy Contest / S15W4 - Death Cross Vs Golden Cross.
When it comes to trading chart patterns like golden and death cross are very important you can't ignore them if you want to make better decisions in this post I have broken down what these two chart patterns are for you to understand.
1.- Explain in your own words, what is the golden crossing and what is the crossing of death.

Before we can begin to explain what golden and death crossing are it will be better for us to have an understanding of what moving average means.
Moving Average is a line that is plotted over a price chart that measures the average price of an asset in a given time frame.
We have a moving average that is of 200 days MA which help traders to measure the average price of a traded asset in the last 200 days which you will get to know more as we will be explaining further.
| Golden Crossing |
|---|
Golden Crossing is known as a chart pattern that involves a longer and shorter moving average. It is called the golden Crossing when the shorter moving average crosses above the longer moving average. The shorter moving average is the 50-day MA, whereas the 200-day MA is the longer moving average.
Tradingview app
Golden Crossing can happen in any timeframe, no matter the time frame that you are using as long as you have seen that the shorter-term moving average has crossed over the longer-term moving average then you should know that it is a golden crossing.
Saying a golden crossing has three phases makes traders identify a golden crossing the three phases are:
During a downtrend move, the shorter-term moving average is below that of the longer-term moving average.
When there is a trend reverses, and you see that the shorter-term moving average will cross above the longer-term moving average.
During an uptrend, the shorter-term moving average usually stays above the longer-term moving average.
Golden Crossing is considered a bullish signal since the shorter-term moving average is crossing above the longer-term moving average. However, if the shorter-term moving average is crossing below the longer-term moving average It is considered a bearish signal.
| Death Crossing |
|---|
The opposite of golding crossing is purely what death crossing is. A death crossing is also a chart pattern that involves two moving averages such as shorter-term and longer-term moving averages. It is called death crossing when the shorter-term moving average crosses below the longer-term moving average.
50The-day moving average is the shorter-term MA, whereas the 200-day is the longer-term moving average for example if the 50-day moving average crosses below the 200-day moving, or the 200-day moving average crosses above the 50-day moving average it is known as a death crossing.
Tradingview app
Death Crossing can happen in any time frame and it is the type of crossing that is considered to be a bearish signal. Basically, in a death crossing three phases make traders identify death crossing the three phases are
During an uptrend, the shorter-term moving average is above that of the longer-term moving average.
When there is a trend reverses, and you see that the shorter-term moving average will cross below the longer-term moving average.
During a downtrend, the shorter-term moving average usually stays below the longer-term moving average.
2.- Use the BTC/USDT pair to show the golden crossover and the crossover of death, in Tradingview. Also, use the STEEM/USDT pair to show the golden cross and the death cross. Screenshots are required.
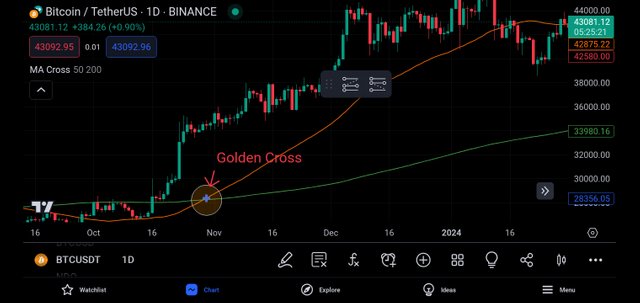
| BTC/USDT Golden Crossover |
|---|
From the above chart, the 50-day MA is crossing above the 200-day MA which the 50-day MA trended down over several trading periods before it finally reached a price level that the market couldn't support. The 200-day MA flattened out after a downward move.
Tradingview app
The price of BTC/USDT gradually increased over time, thereby creating an upward trend in the 50-day MA. From the chart, you can see that the trend continues pushing the shorter-term moving average higher than the longer moving average which then forms a golden crossover confirming a reversal from a downward trend to an upward trend.
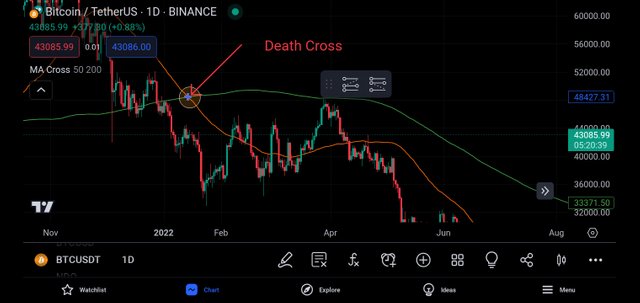
| BTC/USDT Death Crossover |
|---|
From the above chart, the 50-day MA is below the 200-day MA and flattened which the 50-day MA trend upward before reaching levels it can't continue.
Tradingview app
In the BTC chart, the longer-term 200-day MA has been above the shorter-term 50-day moving average for a long time. As of early today, BTC/USDT built a golden cross and broke out the downtrend upper.
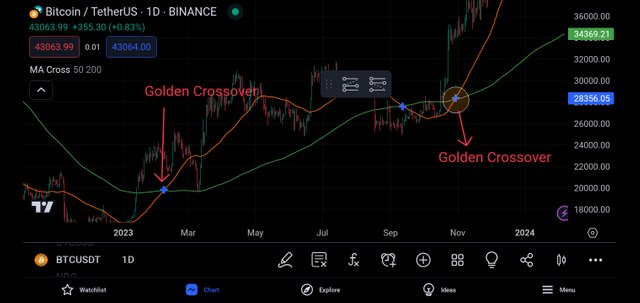
| STEEM/USDT Golden Crossover |
|---|
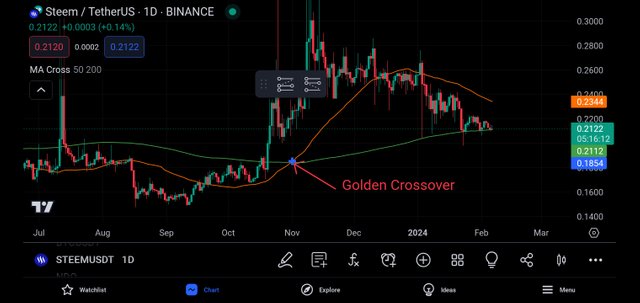
Tradingview app
From the above chart of STEEM/USDT Golden Crossover, you can see that the shorter-term moving average which is the 50-day MA is crossing above the longer-term moving average which is caused by a rise in the price of STEEM/USDT.
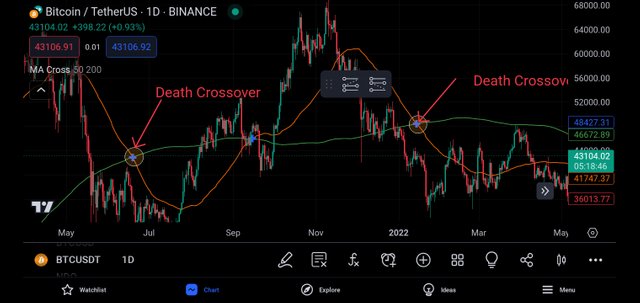
| STEEM/USDT Death Crossover |
|---|
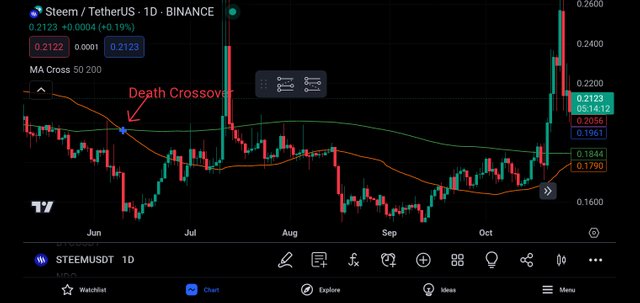
Tradingview app
From the above chart of STEEM/USDT Death Crossover, you can see that the shorter-term moving average which is the 40-day MA is crossing below the longer moving average of the 200-day MA which is causing my fall in the price of STEEM/USDT.
3.- What is the difference between the golden crossover and the death crossover?
Golden crossover and the death crossover are two technical analysis patterns that help traders to know about price movement on a chart which is also best used to identify future changes in the market.
These two as we have learnt earlier have what makes them different from each other in this post the key difference has been discussed in a tabular form.
| Key Difference | Golden Crossover | Death Crossover |
|---|---|---|
| By definition | Golden crossover occurs when the shorter-term moving average crossover the longer-term moving average. | Death crossover occurs when the short-term moving average crosses below the longer-term moving average. |
| By significance | Golden Crossover is considered a bullish signal indicating a potential uptrend. | Death crossover is considered a bearish signal indicating a potential downtrend. |
| By Trading strategy | Traders and investors might consider buying or adopting more aggressive position. | Traders and investors might consider short-selling or adopting more defensive positions |
| By market sentiment | It indicates a shift towards positive market sentiment | It indicates a shift towards negative market sentiment. |
| By confirmation | It is mostly used with other indicators or chart patterns for confirmation | It can also be used with other indicators or chart patterns for confirmation. |
4.- In addition to these two chartist patterns, what other indicator would you add to make the technical analysis more effective at the moment of making a decision?
The relative strength index is the other indicator that I would add to make the technical analysis more effective at the moment of making a decision.
We all know that RSI is an indicator that is used to know the level of overbought and oversold when the RSI line is above 70 it means the asset is overbought which in Golden and death crosses it should the shorter-term moving average should be Crossing above the longer-term moving average.
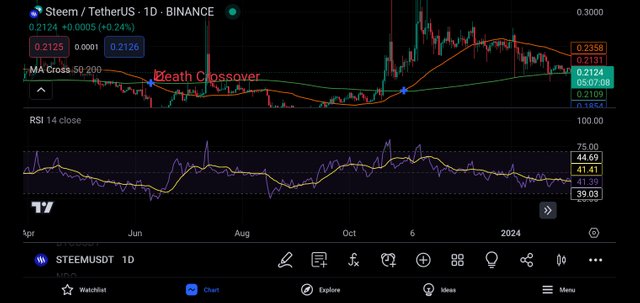
Tradingview app
In RSI anything that is below 30 means the asset is oversold which in death and golden crossing means that the shorter-term moving average is below the longer-term moving average which means adding RSI to death and golden cross chart pattern I would be able to make an effective decision.
I am inviting my friends; @dave-hanny, @woka-happiness, and @vickyson to also join me.
Thank you, friend!


I'm @steem.history, who is steem witness.
Thank you for witnessvoting for me.
please click it!
(Go to https://steemit.com/~witnesses and type fbslo at the bottom of the page)
The weight is reduced because of the lack of Voting Power. If you vote for me as a witness, you can get my little vote.
Upvoted. Thank You for sending some of your rewards to @null. It will make Steem stronger.
TEAM 5
Congratulations! Your comment has been upvoted through steemcurator08.Greetings friend,
You explained the golden crossover and death crossover in a really easy to understand. I love how you provided detailed analysis for both the BTC/USDT and STEEM/USDT pairs. It's great to see examples of both types of crossovers, which really adds depth to your post.
I also appreciate that you mentioned the Relative Strength Index (RSI) as an additional indicator. It's awesome how RSI can complement the golden and death crosses, giving us even more insights for technical analysis.
Your post is amazing. It's clear, informative, and easy to follow. Keep up the fantastic work and all the best
Thanks for your support here.
Well my dear friend your post is always very informative well explained and your analysis is so good is it understand for everybody and you wrote the article so much in detail and I must say you have better understanding and knowledge when ever I read your post and just through the points and in simple language and I must same you have done a very good job.
When I go through your post the chart you are using by the use of BTC and Steem you have wrote so well and best of luck for your participation
Saludos cordiales hermosa amiga jasminemary, te felicito por tus buenas respuestas, cada interrogante las abordaste de una manera perfecta, dando la mejor explicación de los cruces de las EMA según sea el caso.
Bendiciones.
It great and a pleasure reading through your post.
° you have clearly explained what death cross and golden cross is to my satisfaction. Your usage of the btc chart to explain the two chart patterns was awesome.
° you also stated 5 differences between the two chart patterns which is laudable which you also explained
° Your choice of RSI as an indicator to be used in conjunction with golden cross and death cross is superb.
Overall. I read your post with great delight.
Wishing you the best in this engagement.
Thanks for findind post meaningful enough.
Hello dear, greetings to you. I hope you are enjoying the sweet moments of your life.
You define Moving Average as, a line that is plotted over a price chart that measures the average price of an asset in a given time frame. Yes very true dear. For finding out golden crossover and Death Crossover we need two types of Moving averages. One should be 50 MA and other should be 200MA. The Golden crossover is made when the 50 days moving average cross the 200 days moving average in upward direction. The death crossover is completely opposite of it.
You have beautifully explained the difference between these two. Yes that's true that golden crossover always gives us a buying, while death crossover give us selling signal. The graphs for BTC and STEEM are well explained too. You have used binance exchange to show us how golden and Death Crossover is made.
You are using RSI indicator too. Yes This is too easy indicators to be used, plus good thing is that, it gives us most of the time accurate signals too.
Wish you best of luck in the contest, keep blessing.
Has explicado con detalle el concepto de la cruz dorada y la cruz de la muerte como señales de tendencia alcista y bajista respectivamente.
Igualmente has establecido claramente las diferencias entre los cruces de las medias móviles dorada y de muerte.
El uso del indicador RSI para complementar el análisis es pertinente y muy útil para aumentar el poder en la toma de decisiones.
Gracias por compartir
¡Saludos y éxitos!