Steemit Crypto Academy Contest / S14W5 -Exploring STEEM/USDT Trading .
Hello friends, I believe you enjoy your Christmas celebration, and hoping to enjoy the new year also. I wish you more favor in life to enjoy with your family.
 canvas background
Here, I welcome you to this post, in which I have discussed many things in the area of technical analysis, trading strategies, risk management, and so on.
Technical analysis:
Using the MACD, how can you identify a buy or sell signal for the STEEM/USDT pair? And what do the upper band and lower band in the Bollinger Bands for the STEEM/USDT pair indicate?
Before we get fully to how we can use the MACD to identify the buy or sell signal for the STEEM/USDT pair, let's first look at what MACD means briefly.
 screenshot from Tradingview app
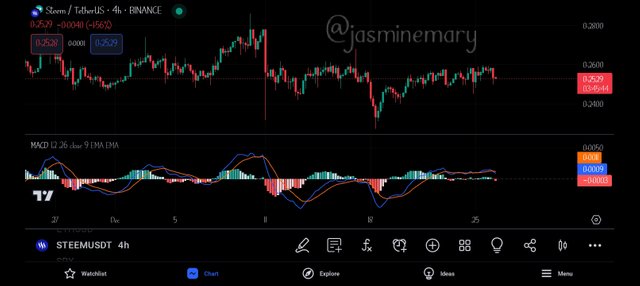
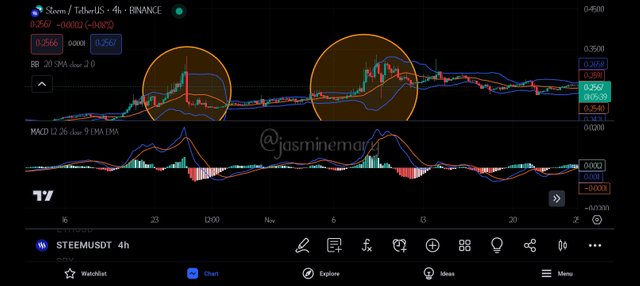
MACD stands for Moving Average Convergence-Divergence indicator. It is an indicator that has 2 lines which are the Signal and MACD line that you can use and generate a buy or sell signal for the STEEM/USDT pair or any other crypto pair. It also helps you to know if an asset is overbought or oversold. Now, let's take a look at how we can use MACD to identify a buy or sell signal for the STEEM/USDT pair.
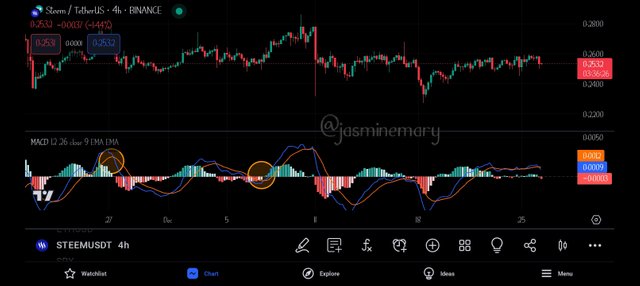
Looking at the chart, you can see the MACD line, the Signal line, and also a bar chart in the screenshot. Now, when you see that the MACD line has crossed above the signal line, you should place a buy sign. (When the MACD line crosses above the line it means a buy signal.
If the MACD crosses below the signal line, it is identified as a sell signal. In the chart of STEEM/USDT that is shared above you can see how the MACD line crosses above the line and also falls below the line as indicated in the screenshot image.
The 2 lines fluctuate around that of the zero line, which means when you see that the MACD or the signal line has crossed below the zero line a sell signal is identified, and a buy signal is identified when the lines cross above the signal line.
The upper band and lower band in the Bollinger Bands for the STEEM/USDT pair
 screenshot from Tradingview app
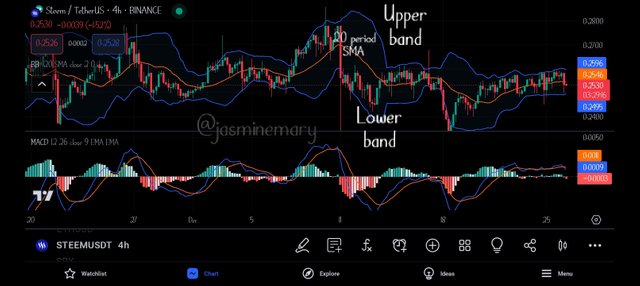
From the screenshot, you can see that the Bollinger bands have both upper, middle, and lower bands. The middle band stands for 20 period SMA which is surrounded by the upper Bollinger bands and the lower Bollinger bands.
Using the STEEM/USDT pair, at the time the price of Steem closed above the upper Bollinger band, the price became overbought which it then retreated slowly in price. At this point, smart traders begin selling their Steem, whereas some set a hedge against the potential place the price retreats from.
 screenshot from Tradingview app
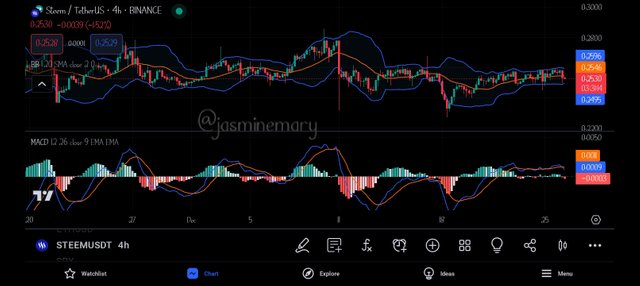
On the other side, at the time the price of Steem dipped (fall) below the lower Bollinger band, the market became oversold which most traders saw as an opportunity to buy Steem back.
Trading Strategies:
How can the combination of RSI and moving average help determine entry and exit points for STEEM/USDT? And how could a trader use the Stochastic Oscillator to confirm bullish or bearish trends in the STEEM/USDT pair?
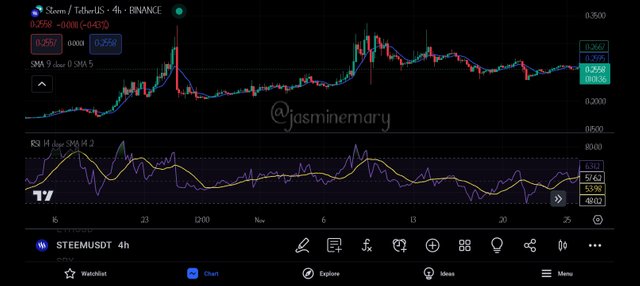
The combination of RSI and moving average can help determine entry and exit points for the STEEM/USDT pair and also help provide traders with additional confirmation and increase trading signal.
As a trader when you combine both, you will gain more valuable insights on potential reversal points and trends. First, let's look at how we can use the indicator for the buy signal.
 screenshot from Tradingview app
For you to determine a buy signal, using RSI and moving average you will need to identify if the price of Steem/USDT is an Uptrend by observing higher highs, and higher lows in the chart of STEEM/USDT.
In this case, you will have to confirm if the RSI is above the level of 50, which is an indication that the market is bullish. After seeing this, look at the chart there is a strong crossover of the 20-day moving average. For a buy position, the cross should be above the 50-day moving average.
 screenshot from Tradingview app
For a sell signal using the combination of RSI and moving average, you will need to identify a downtrend by looking for lower highs and lower lows on the chart of STEEM/USDT. Confirm if the RSI is below below 50 level, which means a bearish trend.
Look on the chart for a bearish crossover of the moving average and once you see that there is a cross you can place a sell position since it is a sell signal.
Entry and Exit Points
 screenshot from Tradingview app
For an entry and exit point, you will need to consider adding additional information like support and resistance levels to make proper decisions.
Using a Stochastic Oscillator to confirm bullish or bearish trends in the STEEM/USDT pair?
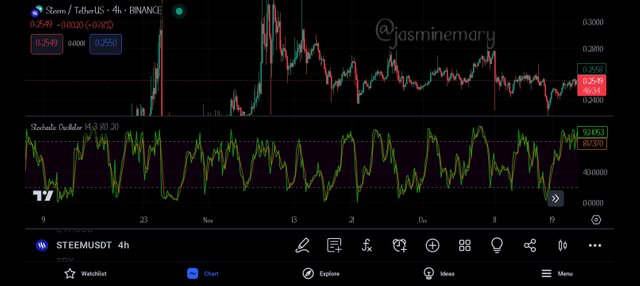
To confirm bullish or bearish trends in the STEEM/USDT pair using a Stochastic Oscillator, you will have to look out for a point that is above or below 20.
 screenshot from Tradingview app
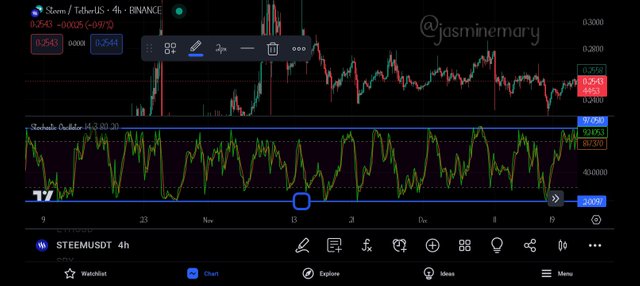
To this, when you see that the Stochastic Oscillator is above 80 points it means is a confirmation of a strong bullish trend, but when you see that the Stochastic Oscillator is below 20 points it means it is a confirmation of a strong bearish trend.
 screenshot from Tradingview app
Now, in a situation where you see that the Stochastic Oscillator, is in the area of overbought or oversold, don't panic instead, just point an eye on the chart and follow the trend before making a move.
Risk management:
How important is a stop-loss when trading STEEM/USDT, and how can it be set based on technical analysis? Why is it essential to diversify positions when trading the STEEM/USDT pair?
Stop-loss is very important when trading STEEM/USDT, as the stop is what helps traders and investors limit losses in the market when a position is open. The most important thing about stop-loss is I wouldn't be awake to monitor my trade since it is an automatic order that helps me close my position and prevents me from further losses.
 screenshot from Tradingview app
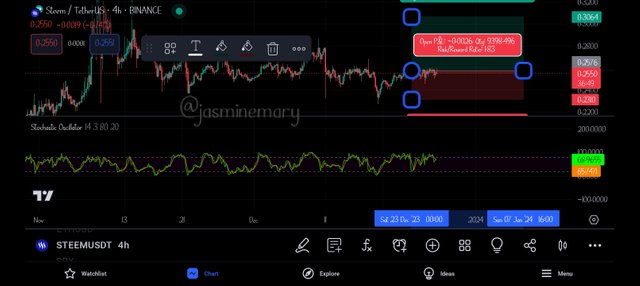
For example, I am trading on STEEM/USDT and I buy Steem at $0.25 I don't want to hold Steem if the price falls to below $0.23, and I want to sell it and close my position at the level $0.23 I have two ways to close my position.
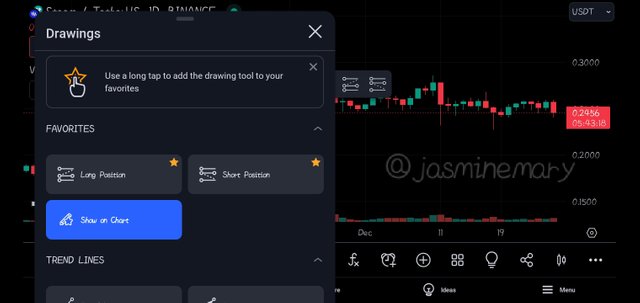
It is either I monitor the price and close my position manually or I set the stop loss order so it can trigger automatically once the price of Steem hits $0.23. In setting my stop-loss using trading view click on the icon indicated below in the screenshot and create a sell order as shown in the screenshot.
 screenshot from Tradingview app
At this point, set your stop-loss order at the level you want it to execute.
It is important to diversify positions when trading STEEM/USDT pairs because you don't know if the price will fall or rise back. Like, for a trader with a double mind, you can set both stop-loss and take profit orders which put in both profit and loss. Setting take profit also, can help you achieve profit before the price of STEEM can hit your take profit before it retraces back to your stop-loss.
Fundamental Analysis:
What fundamental factors should one consider before taking a long or short position in STEEM/USDT? and how can external events, such as announcements related to STEEM or stablecoins, influence the trading of the STEEM/USDT pair?
Before taking a long or short position in STEEM/USDT you will first decide between going short or going long. Taking this decision should be supported by how bullish or bearish you feel about the direction of Steem/USDT.
Now, if you feel bullish, and think the price of STEEM/USDT will keep rising, you should take a long position which is the same thing as buying to sell it higher than what you buy if you want to trade on the spot.
If you feel bearish about the price of Steem/USDT that the price of Steem will fall further, you can go for the short position which is sell. If your decision is accurate, you will make profits because the market moves in your favor, but if your decision whether long or short is wrong, then you will be at a loss and the only thing that would limit your losses is the stop-loss you have set.
Extend events, such as announcements related to STEEM stablecoins influence the trading of the STEEM/USDT pair, based on how positive or negative the announcement is. If the announcement is a positive announcement that is in favor of the market, the price of Steem will rise and all those who enter long (buy) will make huge profits.
If the announcement is a negative announcement, which isn't in favor of the Steem/USDT pair, the price of STEEM will fall and all those that enter short (sell) will make huge profits. All this can happen as a result of government rules, and so on.
Leading Indicators:
Apart from commonly used indicators, what other leading indicator could be useful to analyze the behavior of the STEEM/USDT pair? and how can trading volume be interpreted to predict future movements of STEEM/USDT?
 screenshot from Tradingview app
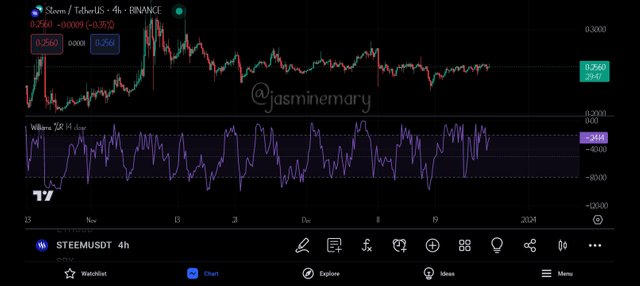
Williams %R is a leading indicator that could be useful to analyze the behavior of the Steem/USDT pair.. it is an indicator that is similar to that of a Stochastic Oscillator the only difference is that Williams indicator works on a negative scale which is ranges between zero (0) and hundred (100) and make uses of -20 and -80 as the level of overbought and oversold.
 screenshot from Tradingview app
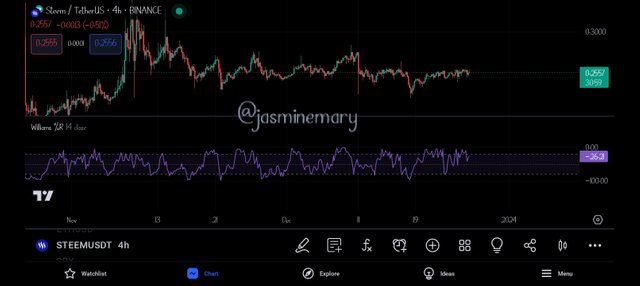
On the chart of STEEM/USDT, when you see that the green line is below - 80 it means the price of Steem is likely to rise, but when you see that the red line is above -20, it means the price of Steem is likely to fall.
Trading volume can be used to predict the future movement of STEEM/USDT as it can help traders gauge the strength of price movements of STEEM, assess liquidity, and measure and interpret the market sentiment of Steem/USDT.
 screenshot from Tradingview app
In all and all a higher volume means there is an increased activity of buyers or sellers in the market which if it's green candles that are higher, it means buyers are more than sellers in the market.
In a nutshell, volume is represented by bars at the bottom of a trading window, just as it is shown in the chart of the STEEM/USDT pair above.
Each of the candlesticks represents the activities of the market and if Steem, closes above the opening price of its candle, the volume bar, and the candle will become green which is an indication that buyers are interested in holding Steem.
Conclusion
This is a very interesting engagement Challenge that has made me learn more things as the questions seem to be more technical than others. I am happy that I have done my best, in passing useful information concerning the contest tips which I will also like my friends; @patjewell, @ruthjoe, and @dave-hanny to also take part.
Good morning friend. Thanks for this beautiful entry.
Like.you said, news both internal and external affect the STEEM/USDT pair. This just happened recently and we saw I to a effect in the market. Negative news leads to drop in prices while positive news leads to radical increase in price.
Generally, you write up was superb. I wish you the best in this contest.
I appreciate your feedback and support me. Thanks
Thank you, friend!


I'm @steem.history, who is steem witness.
Thank you for witnessvoting for me.
please click it!
(Go to https://steemit.com/~witnesses and type fbslo at the bottom of the page)
The weight is reduced because of the lack of Voting Power. If you vote for me as a witness, you can get my little vote.
This was a good contribution. Particularly in terms of decision-making between long and short positions. The emphasis on setting a stop-loss to limit potential losses shows a good risk management approach, and important aspect of successful trading.
I appreciate your acknowledgment of the impact of external events, especially announcements related to STEEM stablecoins, on the trading dynamics of the Steem/USDT pair. The correlation between positive announcements and a subsequent rise in Steem's price is a noteworthy observation. It underscores the importance of staying informed about developments in the Steemit platform and related projects to make informed trading decisions.
Your focus in reducing risk, and awareness of external factors adds a layer of practicality to the trading strategies discussed. Traders can benefit significantly from such information, especially when navigating a dynamic pair like Steem/USDT.
Looking forward to more informative post from you. Keep up the good work!
Thank you and I appreciate your time and support.
Season greetings friend,
Your explanations of the various analysis tools, the fundamentals and how to manage our risks as traders are applaudable, not forgetting what stop-loss is to traders.
You not only showed that you have a good understanding of the various questions of the engagement like the technical aspects, but also that you are committed to educating others with your valuable knowledge.
Your dedication and hard work definitely deserve recognition as I see you put in the work week in, week out. Keep up the great work and compliment of the season.
I am happy that you find my content meaningful enough. Thanks for reading.
hello dear @jasminemary Great insights on trading strategies! 📈 Understanding MACD Bollinger Bands RSI and Stochastic Oscillator for STEEM/USDT. Setting up stop-loss for risk management is crucial. Diversification is like having different crops – it adds resilience to your portfolio. Wishing everyone a prosperous New Year filled with successful trades....
Thanks for your support.
Upvoted. Thank You for sending some of your rewards to @null. It will make Steem stronger.
@jasminemary
We know that internal and external news affects the STEEM/USDT pair. Speaking of which, recently I've seen the market fluctuate and quickly move up and down the market and overall at different points. Others have come to understand that if we talk about the negative, when the news circulates negatively, then what is there has a deep impact on the market. cause increase anyway overall post is great other activity is excellent and as always keep commenting with other friends
Thanks for coming around sir.
I must say to you dear friend you have really amazed me with your content and I must say you are really intelligent smart and creative especially when it comes to crypto related articles like this you explained about all indicators in the best way possible and I must say.
I am amazed at your good work to, so therefore such post should be seen more often.
Thanks for sharing wishing you success please engage on my entry https://steemit.com/hive-108451/@starrchris/steemit-crypto-academy-contest-s14w5-exploring-steem-usdt-tradingwonderful articles
Hello @jasiminemary you explain risk management really well good keep it up
thanks for sharing your quality post.