Crypto Academy Season 4 | Intermediate course by @allbert –week 1: Trading with Strong, Weak and Gap Levels.
You are Welcome to my Homework Season 4 Post
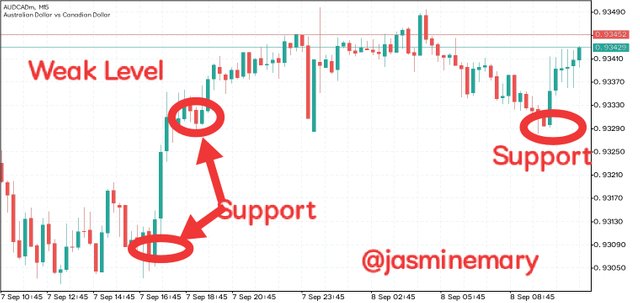
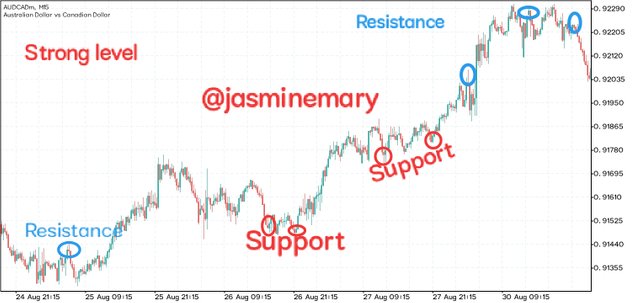
1- Graphically, explain the difference between Weak and Strong Levels. (Screenshots required) Explain what happens in the market for these differences to occur.
Before I start explaining the difference between weak and strong levels, I have to first explain in details the difference of support and resistance levels lines which are also levels of weak and strong levels. Support and resistance levels are horizontal lines that are plotted on the basis of high and low prices on the valley and peaks. Beginners traders usually find it difficult to handle support/resistance lines. They are very technical and difficult, in such a way that it requires a lot of experience and knowledge when performing trade. Although, they are easier to for trader to understand and comprehend because they are plotted in a valleys of low and high prices.
Since the weak and strong levels are also regarded as the support/resistance levels as earlier said. Let's take a quick look at them starting from the weak levels before the strong levels.
Weak Levels:
Weak levels is the level that is not reliable at the support and resistance lines. Looking at the above graph chart of BTC/USD pair we can see a weak levels in the chart. From the chart we can see that the prices of BTC/USD is not moving inline with each other. This indicates that the weak levels or the support/resistance levels only occur when price is falling down.
Strong Levels:
Strong level is the opposite of the weak levels.it is the levels that is more reliable for support and resistance looking at the above chart we can see that the prices of BTC/USD are moving with each other. This indicates that the strong levels or the support/resistance levels occur when price is rising. When it comes to the strong levels price is always fluctuating.
Key difference between weak and strong levels
| Weak level | Strong Level |
|---|---|
| The support levels looks much stronger | The strong levels is formed after the breakout of a weak level. |
| Pending order are less | there are too many pending order that is waiting to be executed |
| Trend reversals are not constant due to the direction that is take | the price trend usually take longer period to be executed |
2- Explain what a Gap is. (Required Screenshots) What happens in the market to cause It.
In a simple word, gap means a vacant space that is empty. In the aspects of trading, Gap is simply means the area on a chart that is empty without trading activity going on. Gap usually appear when price of coin quickly moves faster either in uptrend or downtrend making the chart to be empty in between. When it occur, it simply means that the market price is opened at a price that is different from the previous close price. Let's say that for an example, your earning are more higher that what you are expecting,with this your asset may likely gap up the next day. At this point as at earlier said, it means the price of the asset is opened higher than what it is closed to it previous day, which causes gap to occur.
Explain the types of Gap (Screenshots required, it is not allowed to use the same images of the class).
Gap are of three types, which are Breakaway gap, Runaway gap and the Exhaustion gap. Each of this gap had are explain below with a screenshot.
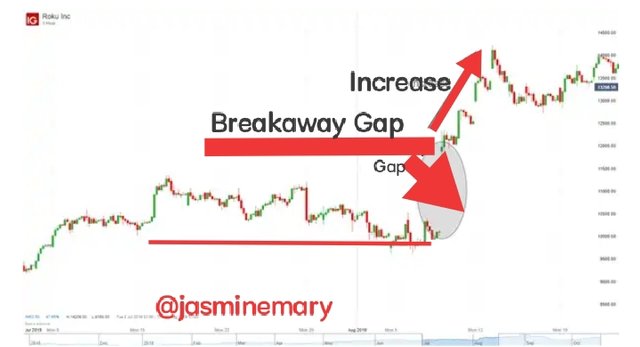
Breakaway gap:
This is the type of gap that occur with trend where the price of asset is gap out of the pattern by causing a breakout. Looking at the screenshot above we can see that three is a breakout in the chart. In a case where the breakaway gap is followed by higher volume of trading, longer position may likely take place.
Runaway Gaps:
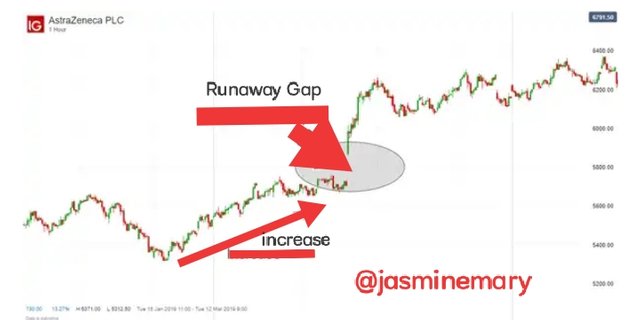
These is the type of gap that occur when there is continues moving of bullish or bearish pattern in the same trend. It is caused whenever a new activities is confirms or continue trend is moving in the same direction. According to professor @allbert,
These are gaps that occur when the trend is still young and represent a trend continuation indicator source.
This is absolutely true to what because this type of gap is usually at the middle point of the chart which traders need to study the trend so they can placed a stop below the gap for a bullish runaway and also s stop above for a bearish. The above screenshot is an example of the runaway gap.
Exhaustion gap:
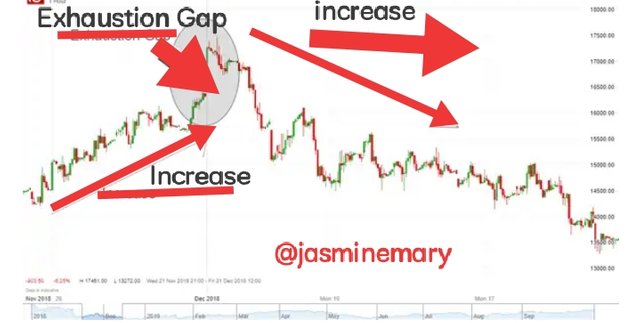
This is the type of gap where price makes a last gap in the trend direction and then reverses. This type of gap is not easy to identify as due to the similarities with that of runaway gap, although it can be identify when the price has changes direction. It is often followed by a large volume,which make it to be a continuation gap or runaway gap.
4- Through a Demo account, perform the (buy/sell) through Strong Supports and resistances. Explain the procedure (Required Screenshots).
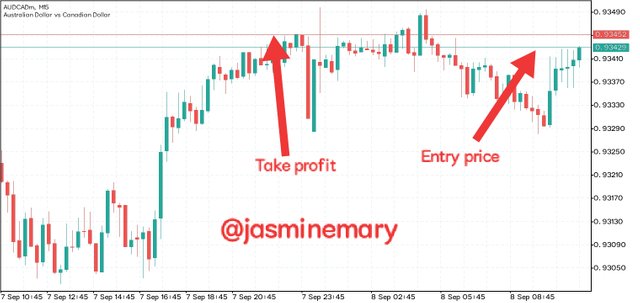
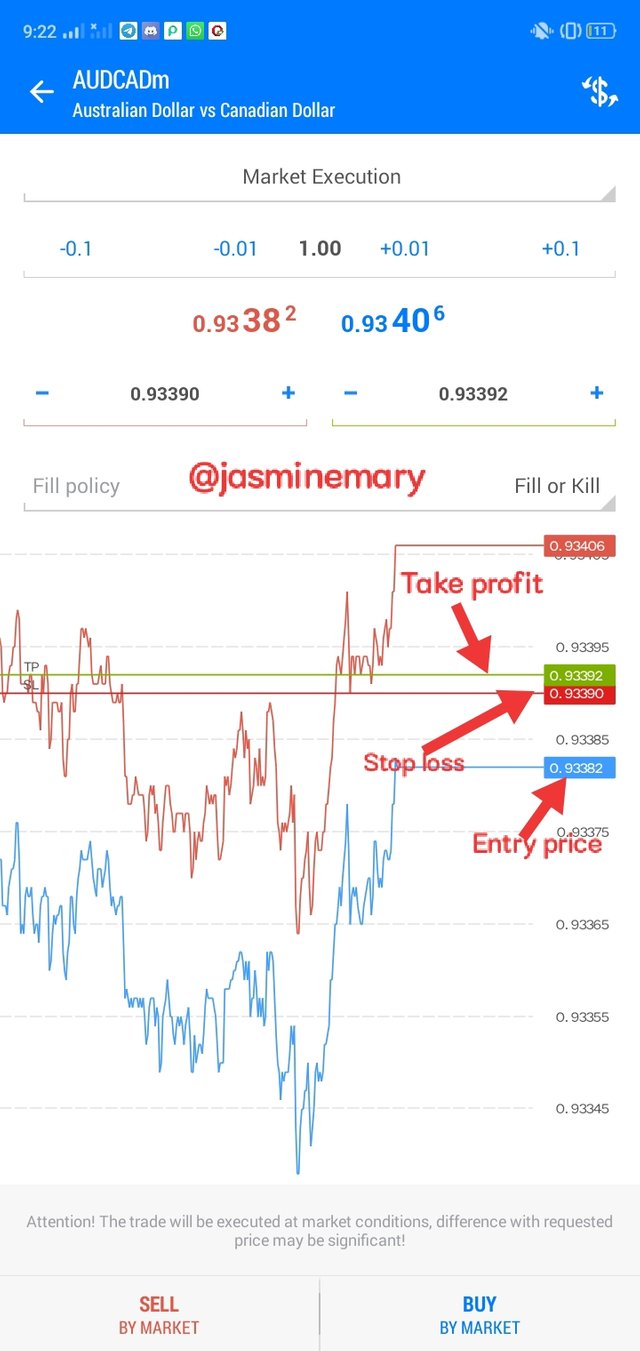
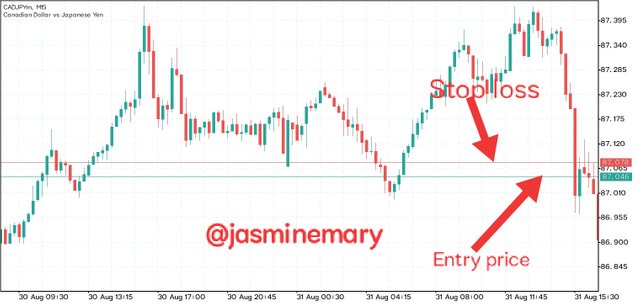
For the purpose of this homework, and in order for me to preform the buy/sell through strong support and resistance, I make use of Metatrade5 using AUD/CAD pairs on 15M Time-frame. At as the time of performing this homework the price of AUD/CAD was at 0.93429 with a strong support and resistance levels. As soon as I noticed that the levels are strong I quickly place a sell order which is shown on the screenshot below.
As soon I place my order, my market entry stood at 0.93382, take profit 0.93392, sell loss 0.93390.
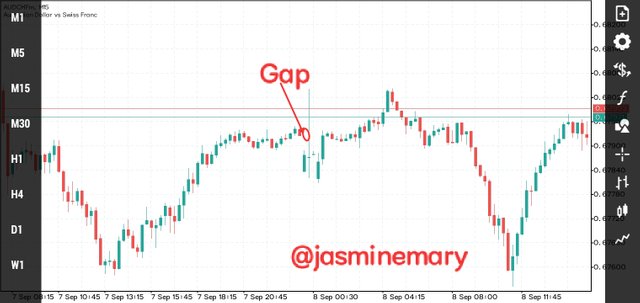
Through a Demo account, perform the (buy/sell) through Gaps levels. Explain the procedure (Required Screenshots).
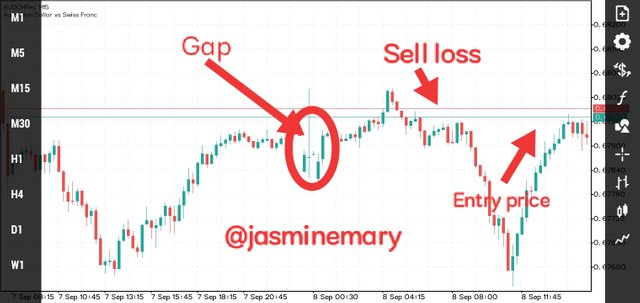
At this point I make use of the break retest method with still Metamask5. The gap is indicated with a circle,and stop loss is placed above the level of the gap to see if I will encounter loss. Although I didn't place and order to trade, but if am to do that my risk reward would be at the ratio of 1:1 to enable me balance my lost. Below is the screenshot.
Conclusion
Gap trading comes with a high possibility of success, which requires traders to carefully study the gap to know it factor before embarking on trading. Like the exhaustion gal that occur close to a price in other to trigger new high or low us sometime confusing. Anyway shall I'm indeed grateful to professor @allbert for his wonderful lesson which has make me to have sound understanding on weak and strong as well gap.
Thank you for your time here my lovely Steemians.......
Best Regards;
Cc:-
@allbert
