Crypto Academy Season 3 | Intermediate Course: Crypto Assets and the Random Index (KDJ)
In your own words define the random index and explain how it is calculated
Random index
Random index, also regarded as stochastic index, is define as a ordinary technical analysis tool that investors make use of in futures and stock markets to identify the similarities between high, low price and market closing price. The random index is calculated based on the price fluctuations which is the highest price, lower and the closing price of the current day strength or weakness of the price trend of overbought or oversold. The acquired K, D and J value are formed at the point when the Index and infinite number of the points are joint together. This is done by calculating the real size of price fluctuations such as the highest, lowest and closing price of the current day. In the case of the design of random index, the random size of the price fluctuation and the calculation of medium term and the short term fluctuation are all looked into, which makes the short term measurement to be more reliable than the moving average, and also more sensitive compare to strong and weak index when predicting price of short term overbought and oversold.
Calculating the KDJ index is not usually easy. But the first, calculation that need to be taking place is to calculate the RSV value of the period of (n,n,n,n, and so on), which is the untimely random index value before calculating the K value, D value, J value and any other value. When calculating the current day KDJ value, the formula below can be use for the calculation:
n day RSV=(Cn-Ln) ÷(Hn-Ln) ×100
Where:
Cn: closing price on the nth day
Ln: lowest price in n days
Hn: highest price in days
RSV: is the value that fluctuates between 1 and 100.
The next step is to calculate the K value,J value and the D value as follows;
Current Day K value = 2/3 × Prior day K value + 1/3 × current day RSV.
For the D is current day D value = 2/3 × prior day D value.
J value is calculated as 3 × day K value - 2 × D value.
Looking at the above explanation I believe it can be of help when calculating random Index.
Is the random index reliable? Explain
To my own understanding, and the practical that I carried out to check if the random index is reliable, I discovered that the random index is very reliable indicator whatever the indicator tell you about concerning if an asset is overbought or oversold it's nothing but the truth concerning such asset. On TradingView I used the random index to check if an asset is overbought or oversold before checking the asset in my Meta4 trade and I discovered that the information that was provided in the random index are all reliable.
 TradingView chart TradingView chart |  Binance chart Binance chart |
|---|
I also compared two different platform to check the KDJ indicator of BNB/USDT in Binance and TradingView and discovered that there are all reliable and the same. There are showing the same signals which is overbought.
How is the random index added to a chart and what are the recommended parameters? (Screenshot required)
To be able to add the random index Ito a chart all you have to do is to follow the simple steps below;
- Go to https://www.tradingview.com and click on chart as indicate below the screenshot.

- Click on fx indicator at the top of TradingView

- Once you have click on the indicator, you will be taking to "Indicators & Strategies" tab, at the top type KDJ in the search bar provided and choose [KDJ] by ll21LAMBOS21 from the list of available options shown below.

- Once you have click apply without changing the settings, the KDJ will be added to your chart as shown below.

What are the recommended parameters?
The default parameters settings is %K 9, %D 3 and %J 3 index. Based on my own experience while checking the KDJ and carrying out some analysis I find out that the KDJ index of daily K-line of the parameters of 9,3,3 is frequent to fluctuation, involving many sensitive and too many invalid signals which causes the KDJ index to be ignored by traders because they think it has no value. But if the parameters can be change we can see the index to be a recommended when studying the trend price of an asset. Based on my experience, the following values is selected for the KDJ index parameters of the daily K-line, that is recommended for 5,19, 25. With this users can easily set their index parameters based on the type of assets their are trading and with specific time frames.
Differences between KDJ, ADX, and ATR
The difference between KDJ, ADX and ATR,is discussed in a tubular form below;
| Key Difference | KDJ | ADX | ATR |
|---|---|---|---|
| Inventor | George Lane | J. Welles Wilder | J. Welles Wilder |
| Objective | is to make trading efforts more useful to trader by attracting the attention of traders | the objective of ADX is to tell traders/investors when the price of assets is in a high or low volatility level when there is a high or low volatility regardless the ty of asset that is traded, timeframe that is chosen | ATR tells when there is a significant movement in price of a certain asset on specific timeframe. |
| Indication | it tell us when an asset is overbought and oversold and also indicate a trend reversal with market entry and exist entry | it indicates the strength and weakness of price movement | indicates how volatile the asset has been moving over a specific timeframe. |
| Line involved | it has three lines which are; K, D and J lines | it consists of; the ADX line, but can also involve DI+ and DI- line | One line |
| Default settings | 9,3,3 | 14,14,14 | 14 |
| Commbinatin | it can be combine with ADX or ATR for decisions making | is combine DMI to determine the trend | it is also combine with moving average indicator (DM) |
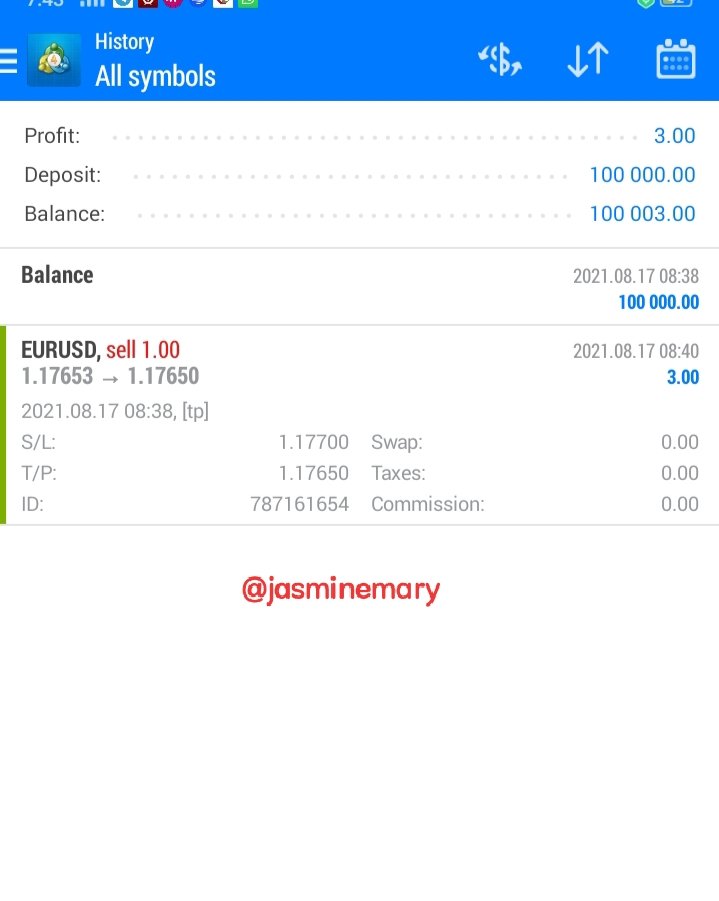
Use the signals of the random index to buy and sell any two cryptocurrencies. (Screenshot required)

From the chart above the J-line crosses above the K and D line which is a sell signal, so I placed a sell order ETH/USD 1D chart and got a profit of $3 USD.
Superb performance @jasminemary!
Thanks for performing the above task in the eighth week of Steemit Crypto Academy Season 3. The time and effort put into this work is appreciated. Hence, you have scored 8.5 out of 10. Here are the details:
Remarks
You have shown an excellent understanding of the topic Mary. And you have done the assigned tasks in a commendable fashion. Your answers to tasks 2, 3 and 4 stood out because they were unique. They also provided the answers we were looking for.
However, there is no conclusion in your work. As a suggestion, conclusion serves as a summary of what have been discussed.