[Candlestick Patterns ] - Steemit Crypto Academy Season 5 - Homework Post for Task 10
.png)
Explain the Japanese candlestick chart? (Original screenshot required).
In your own words, explain why the Japanese Candlestick chart is the most used in the financial market.
Describe a bullish and a bearish candle. Also, explain its anatomy. (Original screenshot required)

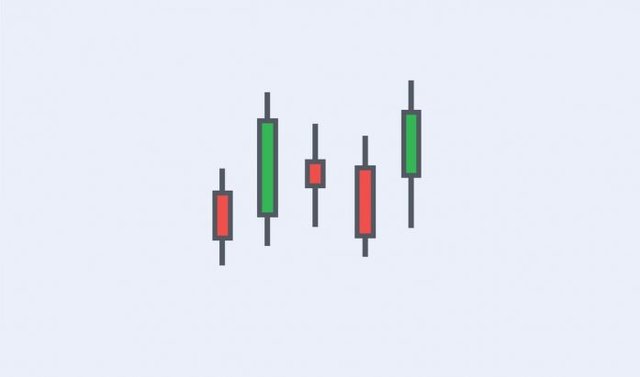
From a candlestick, the real body can be either empty or filled in which is sometimes black. It can red or black as well. When the candlestick is filled with either of the colors, it indicates that the close price of the asset's trading day is lower than the open price but when the real body of the candlestick is not filled or is empty, it indicates that the close price was rather higher than the open price.
The real body is not the only added component of the candlestick as there is also a shadow. Shadows of candlesticks are also called wicks and wicks depict the highest and lowest price points of assets during a trading period.
The candlesticks are differentiated by their colors to help in easily identifying the trends. The 4 components are present for both kind of trends which would be looked at in the subsequent paragraphs when talking about bull and bear candlesticks.
The Japanese candlestick is very similar to the bar chart in the sense that they both give out information. However, the difference is that the Japanese candlestick uses colors to give out more detailed and differentiated information whereas the bar charts are just plane and in one color.
The Japanese candlestick chart results or forms several patterns traders can use to predict the price movement of an asset. These include; doji, which is formed as a result of the same open and close prices, hammer. bearish and bullish engulfing patterns, among others.
The Japanese candlestick is a technical analysis tool that makes use of traders emotions analyzing open, close, high and low price points. These charts are preferred because they show a trader, an asset's trading day high or low price, opening and closing price which are very helpful for technical analysis.
The Japanese candlestick is most preferred because unlike the bar charts and other charts, it aids visual experience with the use of its colors. A black filling of the candlestick's real body indicates that the close price is higher than the open price and no filing tells the trader that close price is lower than the open price. This information from the real body can be used to tell how traders behaved that trading day as to whether they were "greedy" or not.
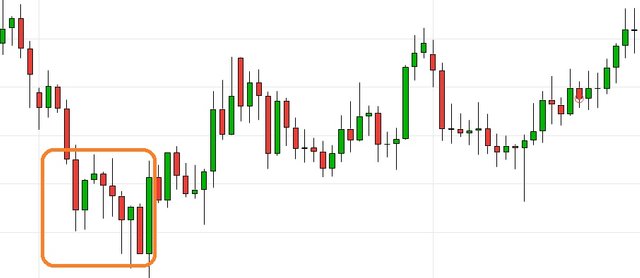
The candlestick aids traders in predicting the price movements of assets. It is preferred because traders can quite easily understand it and it doesn't need special calculations to use unlike some other indicators. When there are green candles after red, it means the market is entering into an uptrend and when there is red after green, the market is entering into a downtrend. Hence, it can also be used to easily determine bear and bull runs of market assets.
Bullish Candle
A bullish candle occurs when the market is in an uptrend. It also occurs when the market is about to enter an uptrend thereby causing a trend reversal. The prices of market assets keeps increasing due to a swing in the market structure from a downtrend.
Bullish candles means that there buyers entering into the trade of a market asset and hence the asset is in high demand. The more there are buyers, the longer the bull run and the higher the asset's price. A bear candle forms when buyers are trying to increase the price of an asset and hence trying to take control from the sellers.
• Open: The open price point shows the first price of a market asset. It is seen at the bottom of a bullish candle during a trading day or trading period.
• Close: The close price point indicates the last price of a market asset. It is seen at the bottom of a bullish candle during a trading period.
• High: The high price point of the candle shows the highest price of the asset during a period.
• Low: The low price point of the candle shows the least price of an asset. It is seen at the bottom of the candlestick below the open price point during a trading period in the bull market.
Bearish Candle
A bearish candle occurs when there is a decrease in market price or value of an asset. It occurs when sellers are want to take control of the market from buyers by selling their assets. Selling of the assets eventually results into significant decrease in value of assets and continuous selling results into longer bear runs.
A bear candle occurs when there is a trend reversal from an uptrend to a downtrend and so red candles are usually seen on the candlestick chart.
• Open: The open price point of a bear candle represents the first price of a market asset. It is seen at the start of an uptrend on top of the bear candle during a trading period.
• Close : This represents the last price of an asset during a trading period of a continuous downtrend. It is observed at the bottom of a bear candle.
• High: The high price point represents the highest price of an asset. It is seen during a bear run during a trading period.
• Low : The low price point represents the lowest price of a market asset. It is seen during a trading period in the market's downtrend.