Steemit Crypto Academy Season 2-Week6 | Homework Task 6 for @kouba : Cryptocurrency Trading with MACD indicator by @janettyanez
Steemit Crypto Academy Season 2-Week6 | Cryptocurrency Trading with MACD indicator
Excellent information presented in a masterful way that facilitated the understanding of this complex topic.
.png)
Image Adaptation with Canva Link
.png)
Q1: What is the MACD indicator simply? Is the MACD Indicator Good for Trading Cryptocurrencies? Which is better, MACD or RSI?
The MACD indicator is the acronym for Moving Average Convergence / Divergence.
This indicator is considered one of the most popular oscillator type technical indicators in trading, for the usefulness of the signals it provides, based on price actions or data in the past, this because it is a retrospective indicator.
That is why allow to establish the time of the market and the measurement of the price trends of cryptocurrencies or other marketable assets, being very useful to determine the possible time to enter or exit.
In , the MACD indicator is one of the most recognized technical indicators by traders and that has remained over time, which allows to measure the price momentum of a cryptocurrency or any marketable value.
It is also important to mention that MACD is composed of:

1.- MACD main line: generated by subtracting two exponential moving averages (EMAs) that are usually configured in 12 periods (faster) and 26 periods (slower).
Also, the configuration of periods can vary from minutes, hours, days, weeks, months, etc.
This line is the result of the 12-day EMA difference and the 26-day EMA, the formula would be:
MACD line -EMA 12d - EMA 26d
2.-Signal line: is the calculation of another exponential moving average usually of 9 periods, when analyzing the MACD main line and this helps us to identify trend changes or possible entry and exit points.
3.-Histogram: is the graphical representation of the divergence and convergence of MACD lines and signal line; this is the result of the differences between the two lines, the representation of which is done with purple bars called MACDh. The histogram, together with the MACD main line and signal line, fluctuate around the center axis or zero line.
4.-Zero Line: is a central axis of the MACD indicator
Fluctuations in the MACD line and signal line above and below the zero line or center axis allow you to pick up buy or sell signals; as well as measuring the divergence and convergence of the price of an asset in a market, through the analysis of price behavior and market trend.
Q.1.1.- Is the MACD indicator good for trading cryptocurrencies?
This indicator is characterized by its versatility for trading analysis, this can be an advantage for trading cryptocurrencies, due to the volatility of these.
However, some experts in the field point out that MACD could be considered useful for specific cryptocurrency trading strategies such as swing trading, because due to the volatility of cryptocurrencies, false signals increase considerably which causes a major disadvantage.
Taking into account the information obtained in the research carried out, the use of this indicator to trade cryptocurrencies, should be considered its use, combined with other indicators that allow it to complement or verify certain signals, as well as in conjunction with a well-structured and proven trading strategy, in addition to the trader's experience in this type of trade.
Q.1.2.-What's better, MACD or RSI?
First of all, it should be emphasized that both are technical indicators that identify the momentum of stock prices or other marketable securities, i.e. both measure the momentum in the market but analyzing different factors and/or functions.
However, it should be noted that constantly in both texts and publications on trading, they emphasize that no transactions should be made based on the analysis of a "single" indicator and/or a single signal.
In this order of ideas, trying to perform a brief comparative analysis of both indicators, in order to give an answer to the question posed, it is important to note, that the IHR complements the MACD very well, in fact this combination is very common.
For its part, the RSI is based on comparing the current price with the previous price over a given period, for its part the MACD is based on the cuts or crosses of two exponential moving averages (EMAs) one long and one short.
The RSI as a comparative or relational indicator, it is ahead of prices, instead of relying only on a crossover of moving averages, it is very useful for Swing Trading and Position Trading operations, being particularly useful combined with a larger RSI (RSI 75), showing us in the graph in addition to a high line of 70 and a low line of 30, a floating center line, which allows us to visualize before the signals of crosses or cuts and the confirmation patterns are more reliable.
However, if we use both combined indicators they offer the trader more confidence to make decisions about opening or exiting a position; this happens when both indicators agree or agree in the direction of prices; but we have to take into account that no indicator is foolproof and we have to be aware of it.
In particular, my choice would be to use both in combination with other technical indicators to increase trading opportunities and take advantage of the benefits that can be offered by the information provided to us by each of them, of course this will depend on the experience and strategy that each trader uses.
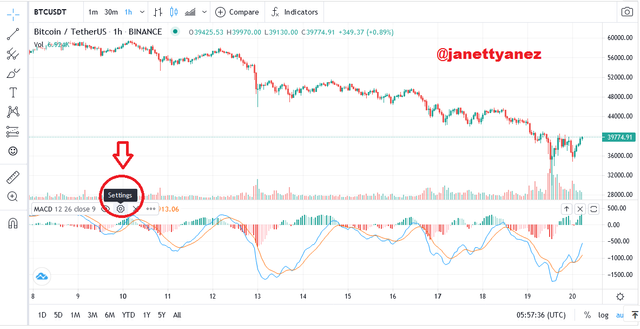
Q.2.-How to add the MACD indicator to the chart, what are its settings, and ways to benefit from them? (Screenshot required)
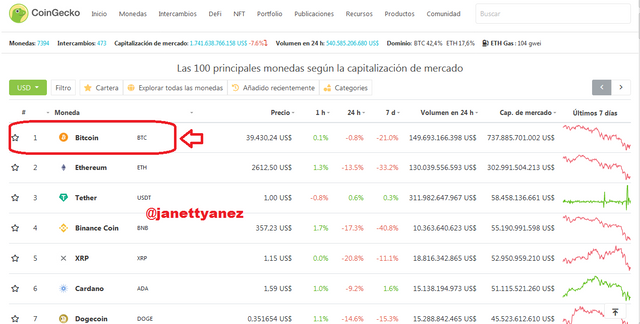
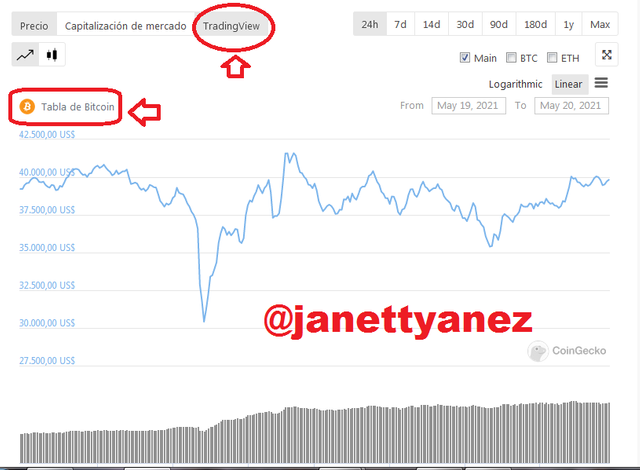
Step 1: Using the www.coingecko.com tool the pair of cryptocurrency to be used is selected, in the case of this publication BTCUSDT was selected
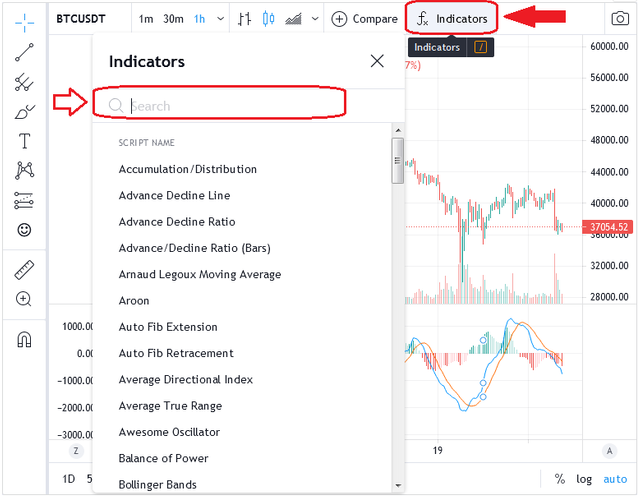
Next, the Indicators option appears on the screen.
The name of the Indicator, MACD, is placed in the search and then a list is displayed where the name appears and is selected.

In relation to the benefits that can be obtained from the adjustments made when configuring the MACD indicator, it will depend on the parameters set in the strategies formulated by each trader, as well as if other indicators are used in combination with the MACD.
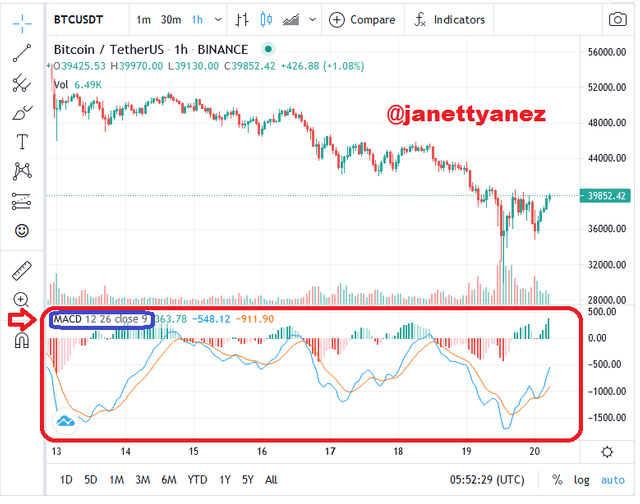
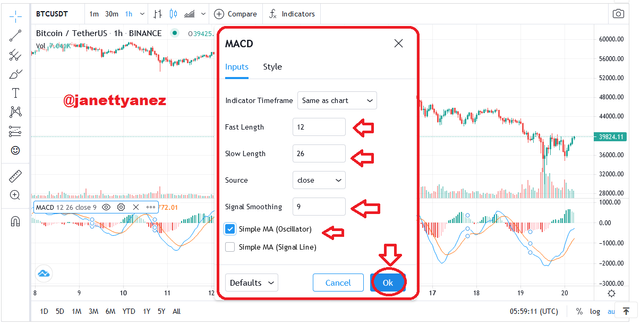
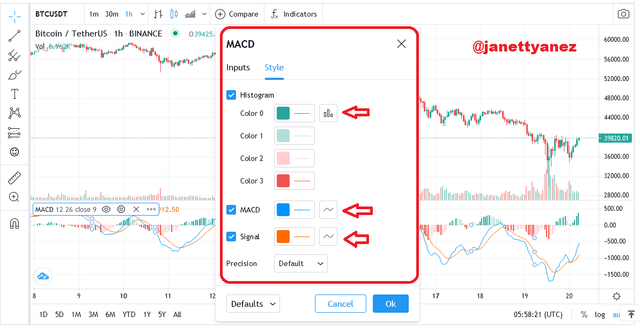
In the configuration of the MACD Indicator there are some settings shown in the platform, such as:
1.- Time Frame: The period adapted to the strategy of each trader ranging from: equal to the chart, 1 minute to 1 month in different intervals.
2.- Change of the EMA: speed adjustment according to the strategy used by the trader according to the periods.
3.-Source: It comes by default closed and the same as the other options can be configured according to the strategy to follow: open, high, low, close, hl2, hlc3 and ohlc4.
4.-Selection of the SMA (Oscillator) and SMA (Signal Line): the simple moving average (SMA) is a non-weighted moving average, which can be configured for the Oscillator and/or for the Signal Line, whose data will be shown in the MACD Indicator chart.

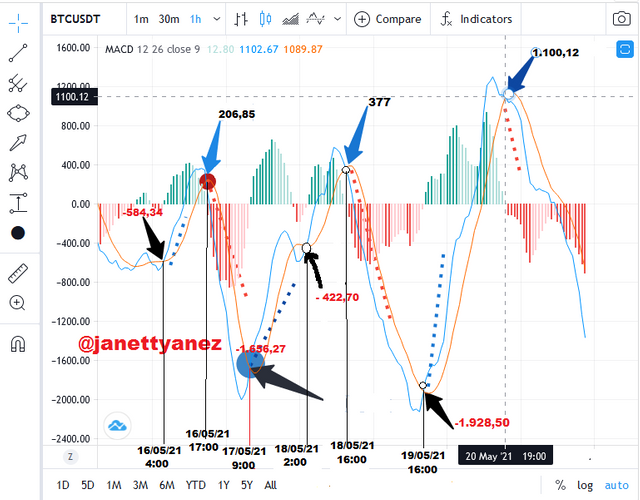
Q.3.-How to use MACD with crossing MACD line and signal line?
Buy Signal: When you cross the MACD Line with the signal line in a booming downtrend (Blue Arrow).
Sell Signal: When the MACD line is crossed with the Signal Line in an in-process uptrend (Black Arrow).
The figure below shows the crosses of the signal line with the MACD line on various occasions, with a red dotted line showing the downtrend of the price and a blue dotted line showing the uptrend.
Q.-3.1.-And How to use the MACD with the crossing of the zero line?
When the MACD line intersects the zero line two scenarios can be presented:
1.- When the MACD line crosses with the zero line towards the positive area, it can be translated as an in-process or bottom-up bullish impulse, indicating that the EMA corresponding to 12 days is greater than that of 26 days.
2.-Otherwise, that is, when the MACD line crosses with the zero line in negative, it translates as a more accentuated or top-down trend, because the 16-day EMA is greater than that of 12 days.
Finally, it should be noted that this indicator may present false signals at the crosses of the MACD Line with the signal line and with the zero line.
However, later in the question related to the false signals of the MACD indicator, it highlights those related to this point.

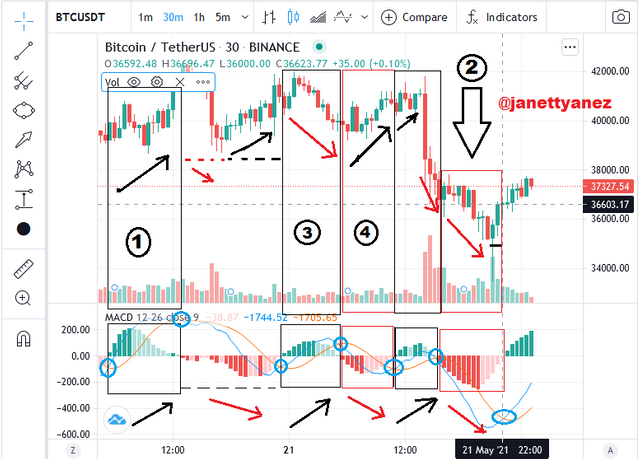
Q.4.-How to detect a trend using the MACD?
In the image shown below, at time 1, a Bullish Trend is identified and at time 2, a Bearish Trend is identified, with the MACD Line and Signal Line crossing points indicated.
Q.4.1.-And how to filter out false signals? (Screenshot required)
To filter the false signals provided by the MACD indicator, some aspects should be taken into consideration, because they can mostly show signals that do not all true and consequently cause losses.
It is very important to take into account in which part of the chart is presented or the signals happen, as well as, it can also directly influence the number of periods that is used for the indicator configuration, because setting a fast moving average risks finding many inputs and outputs, which are mostly false; that is why the recommended system is always 26 (long average) 12 (short average) and 9 (signal).
The image in the example above identifies in time 3 and 4, two false signals can be identified, where in time 3 there is a clear bearish divergence in the price displayed at the crossing of the MACD line and signal line, as well as in the histogram an uptrend.
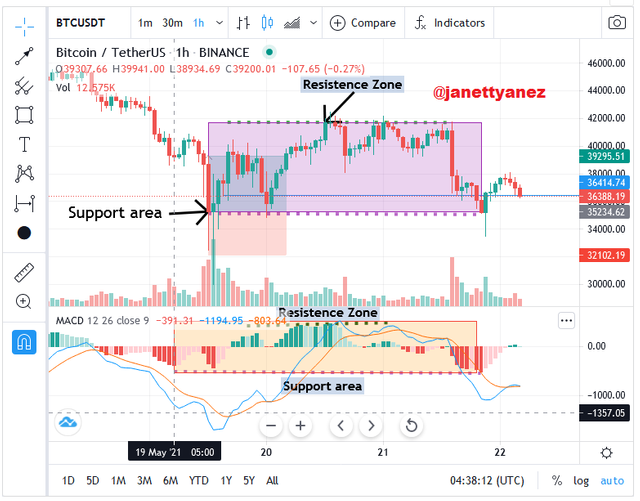
Q.5.-How can the MACD indicator be used to extract points or support and resistance levels on the chart? Use an example to explain the strategy. (Screenshot required)
According to the literature consulted there are several ways to identify these areas and even talk about areas of inflection or congestion, which allow to determine the range of a market, bounces, breaks or reversals.
For identification with the MACD Indicator, BTC/USDT movements and signals corresponding to the period 18/05/2021 to 22/05/2021 were analyzed, as shown in the image below.
It was taken as a support area whose lowest peak reached 35,254 USD (input), as well as my resistance area 41,759 USD (exit), due to the volatility and predominant downtrend of the BTC in recent days, I chose to take the most significant peak to establish these areas by personal judgment.
Just as I considered placing a Stp Loss at $32,356 which is the longest tip of the resistance peak.
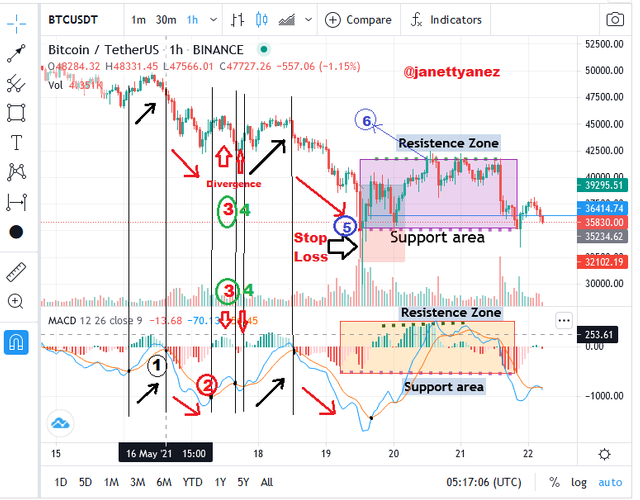
Q.6.-Review the chart of any pair and present the various signals from the MACD. (Screenshot required)
Analysis of the BTC/USDT pair on day 22/05/2021 was performed, using the www.coingecko.com, where the MACD Indicator was configured as studied throughout professor @kouba01' class.
The MACD Indicator components are then analyzed, which were identified in the image below:
(1) Crossing of the MACD Line and signal, where the trend shown in the Histogram of the Indicator was identified, in this case uptrend.
(2) Crossing the MACD line and sonde signal identifies the downtrend of the pressure in that span.
(3) Bearish divergence generated between the market price and the MACD indicator.
(4) Bullish divergence, identified when comparing the market price that is counter-standard to the trend shown with the MACD indicator.
(5) Stop Loss placed at the lowest peak.
(6) The highest peak is set for the position output.
As well as the resistance area and support area that had already been explained in the previous question were also identified.
Conclusion
However, experts recommend its use in combination with other indicators to increase the effectiveness of the results obtained in trading.
Thank you to Professor @kouba01 for the excellent experience I give us with this class and @yohan2on as part of the Steemit Crypto Academy team.
Cc:- @steemitblog ; @steemcurator01 and @steemcurator02
Reference Sources
1.- admiralmarkets.com: Cómo usar el Indicador MACD en profundidad
2.-Trading Coach: Indicador MACD (Moving Average Convergence Divergence)
3.- Farobursatil: Cómo usar y configurar el indicador MACD
4.- Academy.binance.com: Indicador MACD Explicado
5.- Traders.Studio: ¿Cuál es la diferencia entre los indicadores MACD y RSI?
6.-tradingview.com : Soporte y resistencia

Twitter:
https://twitter.com/JANETTYANEZ/status/1395990080188297218
Hello @janettyanez,
Thank you for participating in the 6th Week Crypto Course in its second season and for your efforts to complete the suggested tasks, you deserve a 10/10 rating, according to the following scale:
My review :
Excellent work in which you dealt with the topic in all its aspects well, and your answers to the questions were accurate and clear. Your writing methodology is enjoyed by the reader as we find flexible and interconnected ideas.
Thanks again for your effort, and we look forward to reading your next work.
Sincerely,@kouba01
Hello Professor @kouba01
Thank you very much for your comment.
Thanked once again for everything she has taught us.
Happy Weekend
Regards.