Steemit Crypto Academy, Season 2 Week 4: Homework Post for @koubai01// Cryptocurrency Trading with RSI

Canva Image Adaptation. Source Image
.png)
What is the Relative Strength Index - RSI and How is it Calculated?
The RSI (Relative Strength Index) is an oscillator whose function is to measure the rises or drops in the price of an asset within a set period.
This indicator was created in 1987 by J. Welles Wilder, which is currently used in conjunction with other indicators that complement market analysis.
The RSI is one of the technical indicators used as a cryptocurrency trading analysis tool, which helps us visualize when an asset is oversold or overbought.
This can be displayed on the chart, determining when an asset is overbought when its movements are recorded between 70-100, at the top of the chart; and when it's oversold if it's between 0-30, at the bottom of the graph.
To calculate this indicator manually you can use the following formula:


To calculate the RS, corresponding to 14 periods, they are performed as follows:
For the AG (average of the previous period*13+ gain of the current period)/14
And for AL (average of the previous period *13 + loss of the current period)/14
For the calculation of the RSI for a period of 14 days of an asset, we will take the following data:
The price variation corresponding to the difference between day 14 and day 13, was 0.01 , obtaining an AG=0.0357 and an AL=0.0064
AG is obtained with the sum of the values of the profit series at the closing price of the asset between 14 days, equal for the case of AL but with the values of the series of losses between the 14 days.

Analyzing these results obtained in the formula, as the result is 84, 74, it is above the range of 70, it can be interpreted that the asset is overbought and the chart should show us an uptrend.
However, if the results had been less than 50 the graph would show us a downtrend, as if the result were 30 or less the interpretation would be that the asset is oversold.
However, there are several options for performing these calculations automatically through spreadsheets Excel.
.png)
Can we trust the RSI on cryptocurrency trading and why?
The RSI is a very useful technique in cryptocurrency trading, but to achieve better results it must be accompanied with other indicators and combined with other strategies that allow us to complement or confirm some false signals.
Complementing with indicators such as MACD, stochastic, Exponential Moving Averages (EMA) and Media móvil (MA); as well as combining it with strategies such as support and resistance, moving average crosses, time of day, etc; can be very helpful to achieve the best results, always based on the experience in the market of the trader, the latter plays a key and determining role.
.png)
How do you configure the RSI indicator on the chart and what does the length parameter mean? Why is it equal to 14 by default? Can we change it? (Screen capture required)
The Longuitude parameter on the chart is very important because it is the unit of time selected for the analysis of the market movements of a cryptocurrency, by default it has set 14 periods, as recommended in its beginnings by its creator Wilder, but can be switched to another unit.
Currently, there are controversial opinions regarding the number of periods that need to be adjusted on the chart, some claim that 9, 10 or 25, however I found a couple of authors who ensure that the longer the set period is less the likelihood of falling with false signals.
Below I show the step by step for the RSI configuration in coinmarketcap.com:
Step 1: A free CoinMarketcap account opens

Step 2: I selected in the cryptocurrency tab, to BTC and then pressed the TradingView tab

Step 3: Then press on Fx

Step 4: A Indicators tab is displayed, where it is placed in the RSI search bar.

Step 5: In the Imput tab you can make the change of the period.

Step 6: In this image I show that I change it to 9 periods.
 )
)
Step 7: Press the Style tab where you can make changes such as line thickness in the RSI graph part, as well as line color, etc.

Step 8: Finally some signals are shown in the graph of RSI, maximos, minimos, etc

.png)
How do you interpret the overbought and oversold signals when trading cryptocurrencies? (Screen capture required)
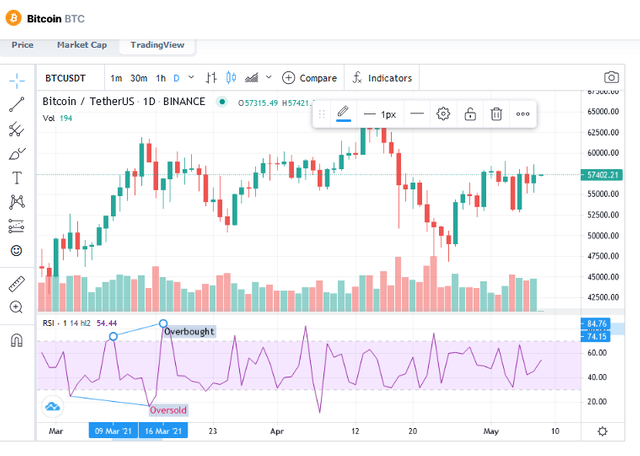
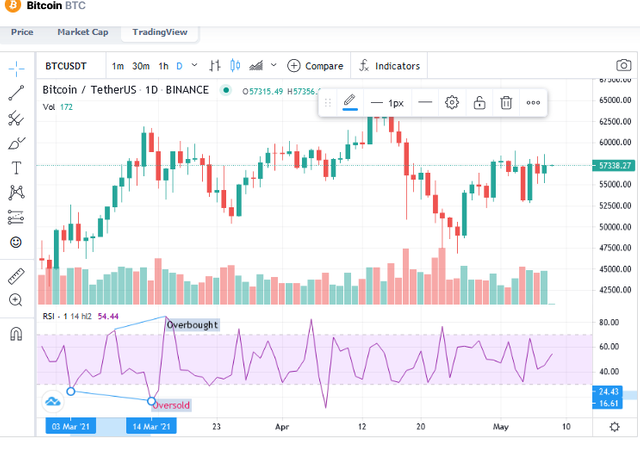
On the RSI indicator chart, overbought or oversold signals occur, in the first case when it is above the set level and in the second case or below it. The most commonly used levels are 70 and 30.
Oversold is interpreted as a situation where the price of the asset is considered to be cheaper than in the previous period, this as a result of little buyer flow.
It usually stop the fall of the price of the asset and starts a rebound effect, but this situation is not 100% safe, that is why it is recommended to combine this oscillator with other indicators that allow to have a greater degree of certainty that the signal is true before performing the trade.
The opposite is the case with overbought, this situation is interpreted as the price of the asset being expensive relative to the last price of the previous period.
This image shows the oversold BTC on day 16/03/21.


.png)
How do we filter RSI signals to distinguish and recognize true signals from false signals. (Screen capture required)
The RSI like other indicators can throw false signals called false movements, Wilder the creator of this indicator stated in relation to it, that these false movements can be identified on the chart when in an uptrend a maximum in the range of 70 or in a downtrend a minimum in the range of 30, is not exceeded by that of the previous period.
An example of this can be seen the screenshot on the displayed graph of the RSI indicator, where drastic changes presented by the BTC during the set period (25) are observed; it is important to note that it is recommended to set periods not so short in order to avoid more false signals.
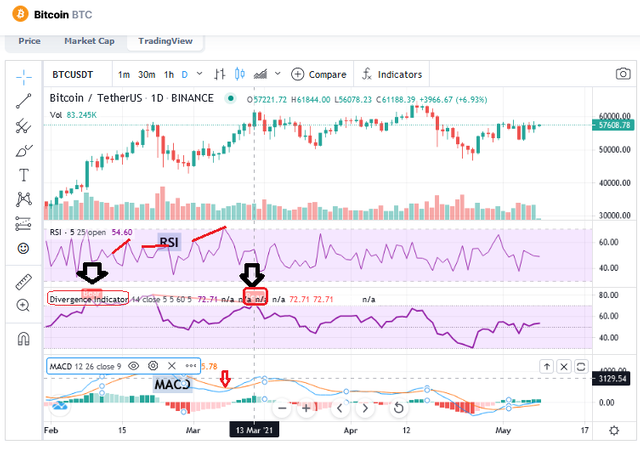
However, to facilitate the detection of false signals in the IHR, there are various techniques that can contribute to this such as the divergence of the IHR or the Indicator, as shown by coinmarketcap.com, which was used for the development of this work.
This technique can identify the bearish divergence as shown in the graph presented below, where the asset price rises continuously, showing that a first peak higher than the next.
And the bullish divergence, where the price of the asset continuously lowers whose pattern is determined because each minimum is higher than the previous one (lower minimum).
Both patterns will help us to identify when the correction in the price of the asset will be presented and thus avoid significant losses, by selling at the wrong time of our position.
However, in order to detect the false signals of this indicator, it is recommended by trading experts to combine it with others such as the convergence divergence of moving averages (MACD), Stochastic, among others; there is a long list of indicators and techniques that used based on knowledge and experience can be very efficient in this market.
The MACD is an indicator that works differently from the IHR but in turn can complement the information presented by the graphs, by comparing the short and medium term positions of a moving average, by comparing both indicators we can see in an established period that there is some coincidence with the reading shown, which reaffirms the decision to be made with our position.
Finally, the Stochastic indicator, despite its similarity in some respects to the IHR, is complemented in two important ranges, that corresponding to the levels, which stochastic covers between 80-20; expanding the margin to be evaluated and the maximum (K) or minimum (SK) lines and closing price lines corresponding to the exponential mean, allowing a greater range of certainty in the interpretation of signals.
For this purpose, the RSI, RSI Divergence and MACD indicators are shown in the image.

.png)
Review the chart of any pair (eg TRX / USD) and present the various signals from the RSI. (Screen capture required)
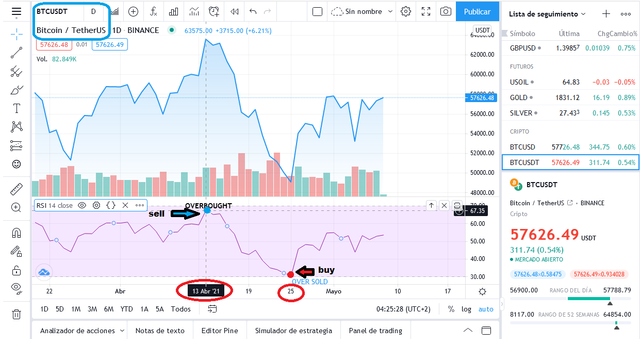
Using my https://es.tradingview.com/ account I performed the requested screen capture as a request for this question, taking the BTC/USDT pair.
The analysis focuses on the span of 13/04/2021 when you can see the overbought signal with the RSI indicator, and then on 25/04/2021, where the oversold signal is detected.

.png)
Conclusion :
The RSI indicator is a very useful tool that has remained over the years resisting market volatility especially in the last decade, where the successful use of technical tools such as indicators and other trading strategies linked to the preparation, training and experience of traders are key to remaining in the market and achieving success.
The RSI is based on the overbought signals being a warning of an asset market reversal, but with the help of other tools we can visualize whether these overbought signals are actually a reversal or a reaffirmation of an uptrend or bearish.
However, bullish and bearish divergences in the asset price and the RSI indicator can be used in non-strong trends to detect buy or sell signals.
In short you can say that this indicator can be of great help to traders who train the use of the various trading techniques as well as playing a very important role also the experience gained over the years in this difficult market.
.png)
Reference Sources:
1.-Faro Bursátil: Cómo usar y configurar el indicador RSI. Link
2.-Envistopedia: Best Indicators to Use With RSI
3.-Envistopedia: Relative Strength Index (RSI)
4.-Tecnicas de Trading: Indicador RSI (Relative Strength Index) – Guía Completa del RSI

Hello @janettyanez,
Thank you for participating in the 4th Week Crypto Course in its second season and for your efforts to complete the suggested tasks, you deserve a 9/10 rating, according to the following scale:
My review :
Excellent article content. I really enjoyed reading it. Your answers are well detailed and clear to the RSI Trade Indicator. Regarding the last question, you could have added other signals to the chart for a more in-depth analysis of the price movement.
Thanks again for your effort, and we look forward to reading your next work.
Sincerely,@kouba01
Thank you very much Professor @kouba01, for your comment, I will take this into consideration for the next tasks.
Thank you for this excellent lesson, I really enjoyed learning like all your lessons.
I will continue your course with many expectations.
Happy weekend.
Best regards.