[Trading strategy with RSI and ICHIMOKU]- Steemit Crypto Academy- Homework post for Professor @abdu.navi03 || by @janemorane

1: Put your understanding into words about the RSI+ichimoku strategy?
Relative Strength Index (RSI):
The RSI is one of the famous momentum-based oscillators used to determine the speed and direction of price changes. The RSI is simply one of the most vital tools or indicators in a trader's arsenal of market measures for developing nearly any trading approach. Only the most inexperienced will look at RSI and predict where the market will go next based on a single number. A bullish divergence, according to Wilder, was an indication that the market was about to rise, while a bearish divergence, according to Cardwell, was only a minor price correction on the way down. RSI is a scale that ranges from 0 to 100 points. The weaker the momentum for market fluctuations, the closer the RSI gets to zero. Likewise, the inverse is true. An RSI of 100 or close to 100 shows a period of stronger momentum.
ICHIMOKU:
The Ichimoku Cloud is a group of technical indicators that displays support and resistance levels, as well as momentum and trend direction. It accomplishes this by plotting numerous averages on a graph. It also employs these numbers to create a "cloud" that seeks to forecast where the price might find future support or resistance.
RSI+Ichimoku strategy:
The RSI+ Ichimoku Strategy is not only helping to understand the movement or fluctuation of traders and let you know about any trend start or avail any opportunity, but this strategy also helps us in the long run if we want to stay with that trend for a long time. If there is a trend, we can start by availing the opportunity of earning, and if there is a reversal, you can exit the trade at the appropriate time. This strategy is used by traders to enhance risk-adjusted returns.
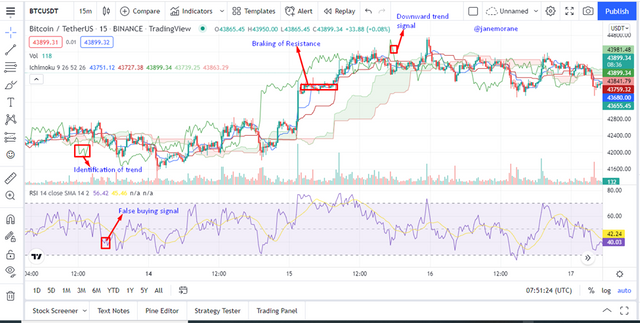 Figure 7: https://www.tradingview.com/chart/0Uf0smzq/
For the analysis, I chose 15-minute time scale Bitcoin/ Tether US chart as shown in the above screenshot. This chart helps us to identify when to buy or sell of the trade. In the above chart I highlight the identification of trend, breaking of resistance, when the market is going downward, and false buying signal.
2: Explain the flaws of RSI and Ichimoku cloud when worked individually?
Flaws of RSI:
The relative strength index (RSI) indicator used to display momentum can stay overbought or oversold for a long time when an asset has a significant rate in either direction. Therefore, the RSI is most useful in an oscillating market where the asset price alternates between bullish and bearish movements. Traders can use the RSI to determine how far prices have moved. The RSI reveals the power of buyers and sellers, allowing you to see which side of the market is losing momentum and which side oversees price. On the indicator pane, the RSI line oscillates between 0 and 100.
The RSI is a price momentum indicator that compares bullish and bearish price momentum and presents the findings in an oscillator that can be placed beneath a price chart. Its signals, like those of most technical indicators, are most accurate when they follow the long-term trend.
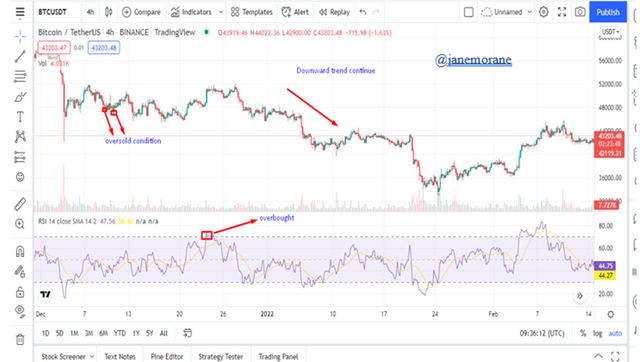 Figure 7: https://www.tradingview.com/chart/0Uf0smzq/
According to above chart, the RSI is unable to determine market purchasing pressure or how long a trend will last. When utilized alone, the RSI is a poor choice, especially in a trending market.
Flaws of ICHIMOKU:
One of the flaws of Ichimoku cloud is that it is dependent on historical data is one of its drawbacks. Historical patterns may not replicate themselves in the future, contrary to traders' expectations.
The second flaws of Ichimoku cloud is like any other technical indicator, can generate erroneous indications. Furthermore, depending on the time span used, the indicator may fail to account for wider patterns.
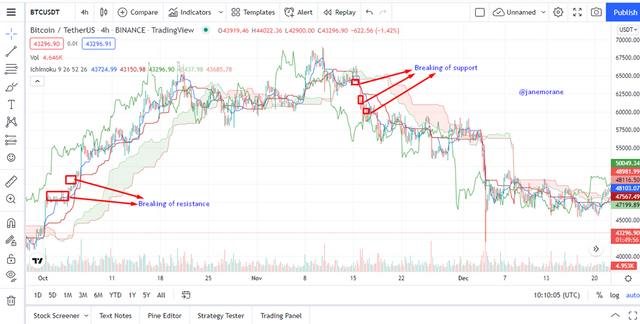 Figure 7: https://www.tradingview.com/chart/0Uf0smzq/
The price oscillates in this sideways market, and the support and resistance formed by the Ichimoku cloud break by the price multiple times, but no trend is followed; only buyers and sellers come in, profit, and leave the market. This is what the Ichimoku could not show us.
3: Explain trend identification by using this strategy (screenshots are required)
Trend identification by using RSI+Ichimoku strategy:
When the RSI rises above 80, the market is considered overbought. Similarly, the RSI is seen to remain in the overbought range during a strong bullish trend. As prices continue to reach new highs, this significant purchasing pressure may be observed in price action. 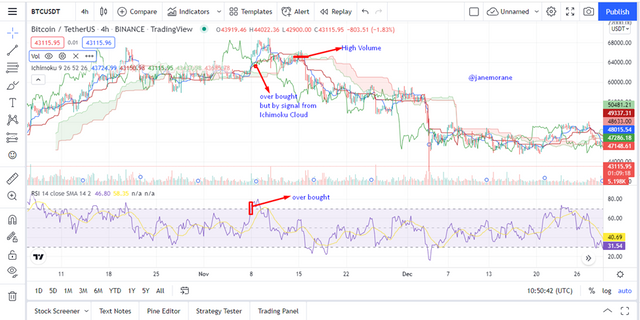 Figure 7: https://www.tradingview.com/chart/0Uf0smzq/
The RSI is unable to identify the significant buying volume that is driving up the price. The Ichimokylu indication comes into play at this point. An uptrend is indicated when the price is trading above the Ichimoku. Furthermore, the uptrend's momentum can be noticed in the Ichimoku cloud's expansion. The RSI line goes to the overbought region, then back to the overbought region after some adjustment, indicating an upward trend as shown in the above chart.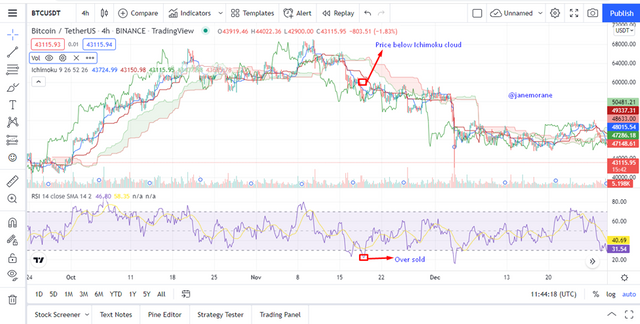 Figure 7: https://www.tradingview.com/chart/0Uf0smzq/
The above chart analysis demonstrates that when the RSI falls below 30, the price is oversold in decline. On the other hand, the oversold region can indicate heavy selling pressure in a drop or at the start of one. On the other hand, the Ichimoku cloud will be used to determine the price volume in a bearish market. A downtrend is indicated when the price is trading below the Ichimoku cloud. The size of the cloud can be used to estimate the volume of the sellers. The volume is proportional to the size of the cloud.
4: Explain the usage of MA with this strategy and what lengths can be good regarding this strategy (screenshots required)
Using MA with RSI+Ichimoku Strategy:
Moving averages reduce the noise in price swings and give you a better indication of which way the market is headed and where it might go in the future. When you remove the noise from a chart, you'll get a much clearer view of what's going on.
The moving average can be used in conjunction with this approach to improve the trading signal's efficiency and to filter false signals from the Ichimoku cloud. The moving average is a trend-following indicator that can be used to spot market trends and reversals. Moving averages are quite beneficial for gaining insight, but you must keep in mind that they do not forecast future performance. Rather, they confirm existing patterns. 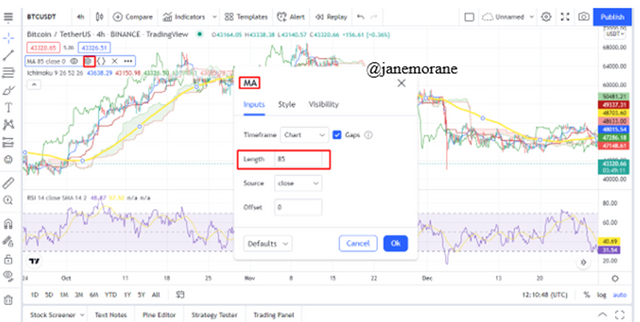 Figure 7: https://www.tradingview.com/chart/0Uf0smzq/
We can set MA period by our own requirement and depends upon that what type of strategy the trader will adopt. In the above chart I used the 85 MA period.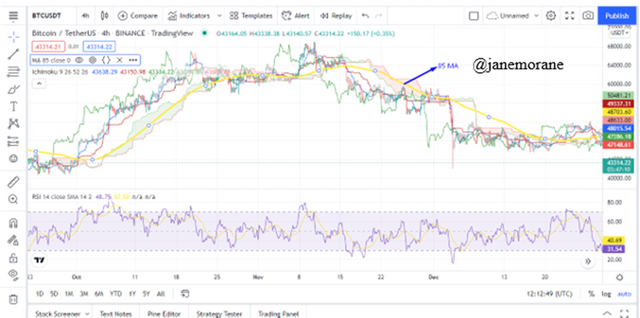 Figure 7: https://www.tradingview.com/chart/0Uf0smzq/
Because the price is trading below the 85 period MA as shown in the above chart, we can see that the MA is converging with the Ichimoku cloud. This confirms that the price is in a downward trend. The MA is included as a confirmation tool to help this technique filter out erroneous signals.
5: Explain support and resistancet with this strategy (screenshots required)
Support and resistancet with RSI+Ichimoku Strategy:
The chart's support and resistance levels are critical because they reflect regions where buyers and sellers are exerting their influence on the price. We'll learn how to distinguish between support and resistance in this technique. The Ichimoku can be used to determine levels of support and resistance in a market that is trending. The RSI, on the other hand, can be utilised to identify support and resistance levels in a rangebound market.
IN TREND:
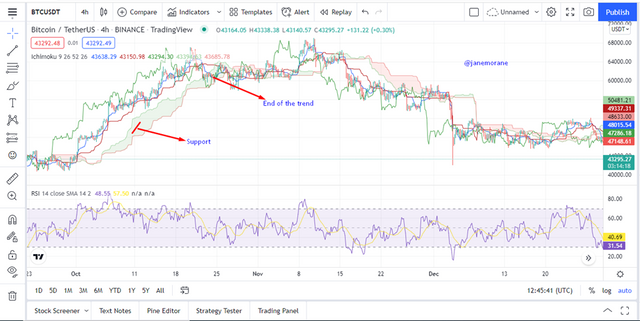 Figure 7: https://www.tradingview.com/chart/0Uf0smzq/
From the above chart analysis, it can be concluded that the Ichimoku provides stability when the cloud is green. The Ichimoku cloud offers support during an uptrend. When the cloud is crimson, the Ichimoku cloud acts as a barrier. The Ichimoku is a chart resistance during a decline. However, when the price reaches a certain cloud level, the current trend weakens. In addition, when the price is far from the cloud, it indicates a significant direction.
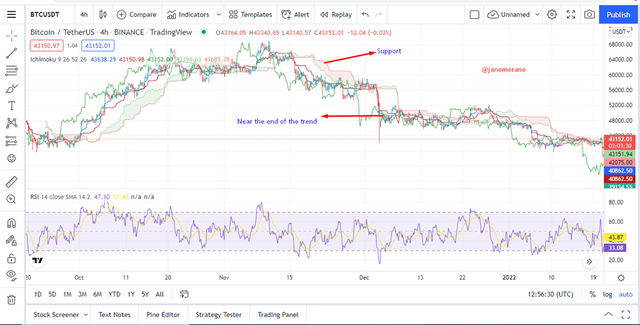 The above chart shows trend reversal in trading.
IN SIDEWAYS MARKET:
The Ichimoku does not produce an accurate trading indication in a sideways market. That's why the RSI will be our go-to indicator in a range-bound market. There is support and resistance in the RSI's overbought and oversold areas The RSI is a momentum indicator that can be used to identify price reversals when they occur.
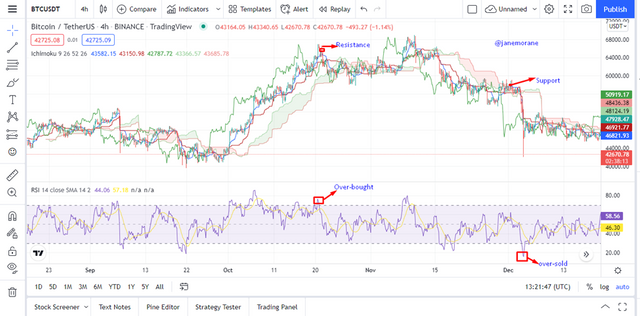 Figure 7: https://www.tradingview.com/chart/0Uf0smzq/
Oversold and overbought areas in RSI chart function as support and resistance, respectively, as can be seen in the figure above. Overbought and oversold zones of a ranging market cause price to be rejected.
6-In your opinion, can this strategy be a good strategy for intraday traders?
In my opinion I am agree that for the intraday this strategy is good if executed correctly, because every trading technique has merits & demerits. Using a trading strategy effectively is dependent on the trader's experience and self-control. You can use this approach to trade on any type of trading platform. Use this approach to discover market patterns while trading intraday. This approach works well in both rising and falling markets. A good way for intraday traders to locate good entry and exit points in the market is to use this method. Additionally, by include the MA, this technique is able to detect and eliminate misleading signals and instances of price rigging altogether. With the correct setups, indicators may be powerful tools for analyzing data.
7-Open two demo trades, one of buying and another one of selling, by using this strategy:
BANK NIFTY Sell Trade:
We can see from the chart below that the RSI has crossed below the 50 line, which indicates that the market is experiencing negative pressure. I also noticed that price had broken below the cloud on the Ichimoku, signaling a shift from a bullish to a negative trend. In order to limit my losses, I opened a sell order with a stop loss above the cloud.
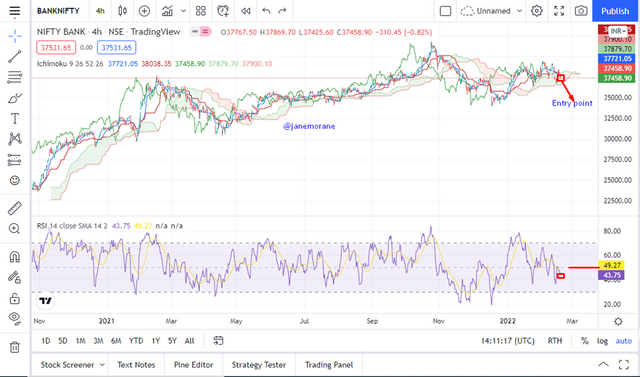 Figure 7: https://www.tradingview.com/chart/0Uf0smzq/
British Pound/U.S Dollar Buy Trade:
A strong purchasing pressure can be seen on the RSI, which I observed when I opened the British Pound/U.S Dollar chart as shown below. As soon as a breakout above the cloud occurred on the Ichimoku, I rushed down to the chart to see if the negative trend had been reversed. It was time for me to open a buy order.
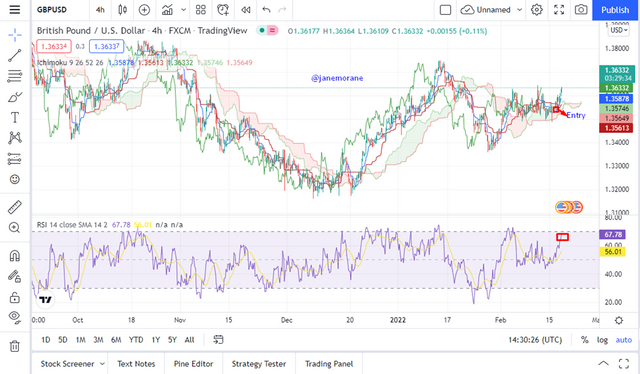 Figure 7: https://www.tradingview.com/chart/0Uf0smzq/

I am thankful to professor @abdu.navi03 for his efforts in making this really amazing and helpful lecture for us, I have learned many things from him.
THANKS FOR YOUR TIME!