Steemit Crypto Academy Season 3 Week 2 - Beginner's Course |Introduction to Charts by @janemorane
Hello Everyone!
Today I am going to do my homework task of Crypto Academy season 3, Week #2. This week's homework task is all about charts used in trading for beginners.
Explain the Japanese Candlestick Chart?
Japanese candlestick chart
Japanese candlestick chart is one of the most widely used charts in Crypto trading. It was first discovered by Munehisa Homma from Japan.
Traders predict the price in the future by analyzing the candlestick chart as it provides different information according to the past price.
A trader can easily determine or predict the future price because the candlestick chart provides information about the opening rise, closing price, the highest and also the lowest price in the market.
Traders use different patterns in Japanese candlestick charts to determine the price and to predict the future market.Some of the patterns followed by traders in candlestick charts are the following.
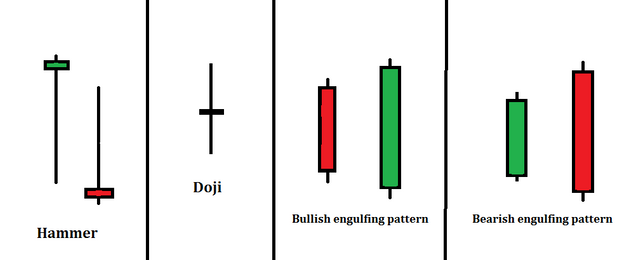
Hammer
A hammer is a candle stick with a long empty tail and a small body at one end . Whenever a hammer is appeared it reverse the trend weather with a downfall in bullish uptrend and a huge uptrend in a bearish down trend.
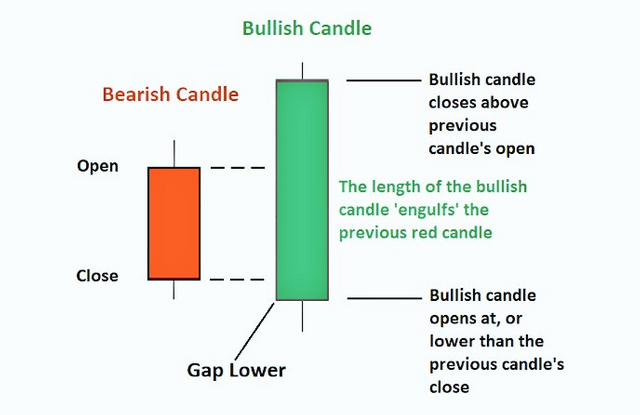
Bullish Engulfing pattern
A bullish engulfing trend is form in the down market, it is candle stick with a green large body engulfing the red bearish candle, whenever a bullish candle appears engulfing the bearish candle it predicts that the market will go up following up trend in the market.
Bearish Engulfing Pattern
Bearish engulfing pattern is the opposite of bullish engulfing pattern that follows a red candle with a large red body engulfing the green bullish body in the uptrend which predicts that the price will go down due to the appearance of bears in the market.
Doji
Doji is a form of pattern in the Japanese candle stick chart, whenever a doji pattern appears in the market it shows that the current opening and closing price of the market are similar and thus a cross of plus (+) pattern is appeared.
 Self made
Describe any other two types of charts? (Screenshot required)
Line Chart
Align chart is one of the charts used in Crypto trading; it plays a vital role in identifying the price overtime. inner line chart the prices of a specific crypto-currency are shown and then they are connected through straight lines and through it can be identified that how much changes occurred in price throughout the time and we can also get information about the opening and closing of the markets from determining the line chart but it does not give us that much information like a candlestick chart.
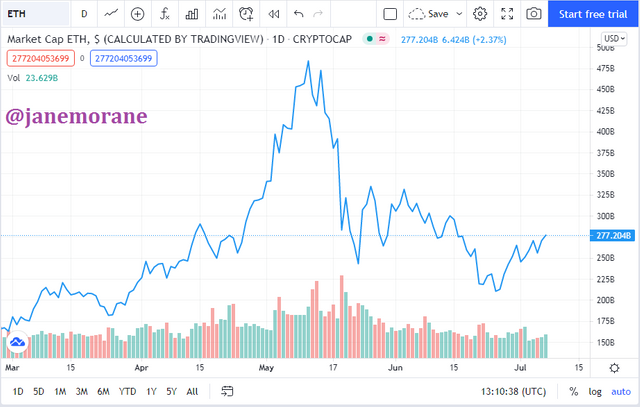 Screenshot taken from Trading view
Bar Chart
Birth chart is one of the most popular charts used in cryptocurrency trading apart from candlestick chart because it also provides most of the information required for the price prediction and to see the overtime market of a specific cryptocurrency from bar chart we can analyse the opening price of the market the closing price of the market and also the highest and lowest price.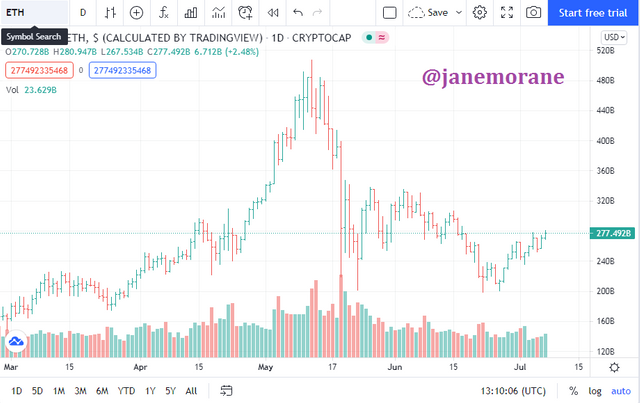 Screenshot from trading view
In your own words, explain why the Japanese Candlestick chart is mostly used by traders.
Well due to my observations and Research Japanese candlestick chart is most widely used by the raiders to analyse the price of particular cryptocurrency in a very easy way. Analyzing candlestick charts and then predicting the future price of the cryptocurrency is known as technical analysis. Most traders use Japanese candle charts just because it provides much more information about the market than the other usual charts.
It provides certain information about the the future price like when the market is open and when the market is going to close, determining the all time high and all time low price in the market and also it helps the traders to analyse whether to go for short trade or wait for a long time according to its candle wicks and depending upon the candle sticks whether they are bearish or bullish.
Describe a bullish candle and a bearish candle identifying its anatomy? (Screenshot is required)
Bullish Candle
Bullish candle is mostly represented by a green candle stick. Whenever a green candlestick or a bullish candle appears it means that the price is going up and this is all because of the bulls in the market. whenever a prize of specific cryptocurrency false the bulls in the market recognized that the fall is very high and the price should not go down that much so they start buying that Crypto cryptocurrency and it prize started moving upward due to bulls in the market and that is called bullish candlestick.
 Self made
Bullish Candle Anatomy
A bullish candle appears in the graph when there are more buyers then the sellers in the market, and a green bullish candle appears and engulfing the small bearish candle and does predict that the price will go up due to the bears back in the market and buying more and more and thus increasing the price forming an uptrend in the market.
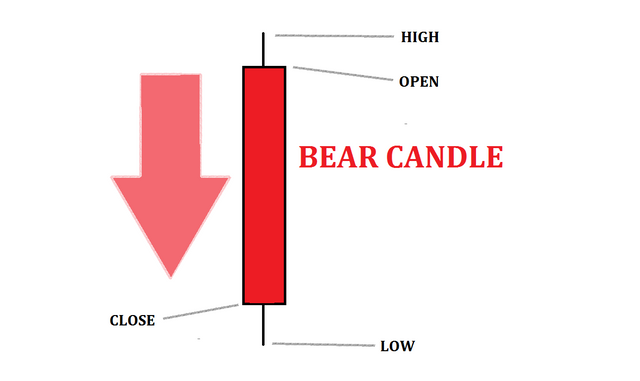
Bearish Candle
Bearish Candle is the opposite of a bullish candle ,Whenever a bearish candle appears in the Japanese candlestick chart it means that the price is going down and many people are selling their cryptocurrency and that's why the price is going down and it is represented with a red candle known as bearish candle.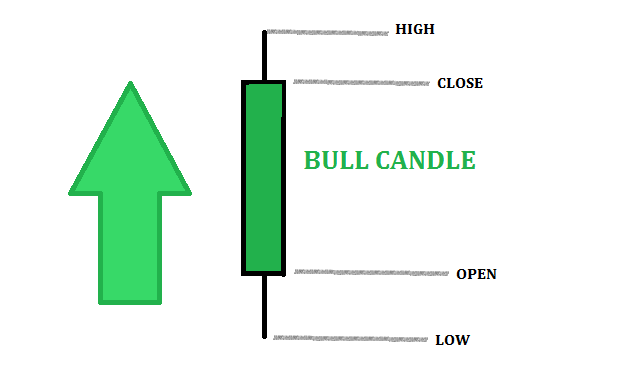
Self made
Bearish Candle Anatomy
The bearish candle and not mean words when there is an uptrend in the market in the price starts downfall a bearish candle appears which engulf the bullish candle and through this we can predict that a great downfall is coming in the market due to the bearish candle engulfing the bullish candle does reducing the price. 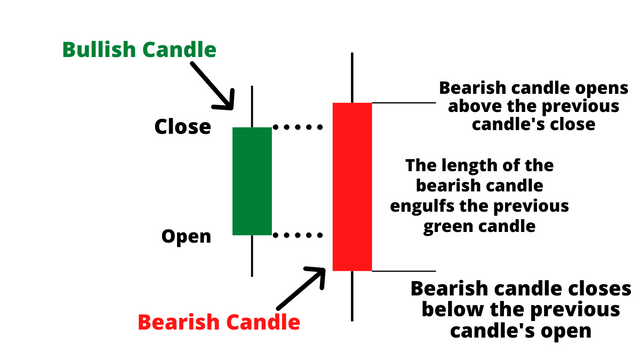 Source
CONCLUSION
In trading Japanese candle chart helps the traders to protect the price hence it is very important for the traders to trade, good understanding of Japanese candle chart along with some other charts is very important if you are interested in trading you must know how to analyse the charts as they are proved to be very useful in trading specially Japanese candle chart is the most widely used chart in trading.
Thank you so much professor @ reminiscence01 fpr your great efforts in making this very useful course for all of us. I have learned a lot from your lecture professor, waiting for the next class.
Thanks for stooping by!
Hello @janemorane , I’m glad you participated in the 2nd week of the Beginner’s class at the Steemit Crypto Academy. Your grades in this task are as follows:
Recommendation / Feedback:
I notice a mistake in your work. You misplaced the bullish candle and the bearish candle. Please edit your work and correct it.
Similarly, proof read your work before submission to avoid grammatical errors in your work.
Thank you for submitting your homework task.