Crypto Academy Week 16-Homework for Professor @Kouba01 -Bollinger Bands
Good day Professor @kouba01 this is my entry post for this weeks assignment
QUESTION 1
Define the Bollinger Bands indicator by explaining its calculation method, how does it work? and what is the best Bollinger Band setup?
Bollinger bands
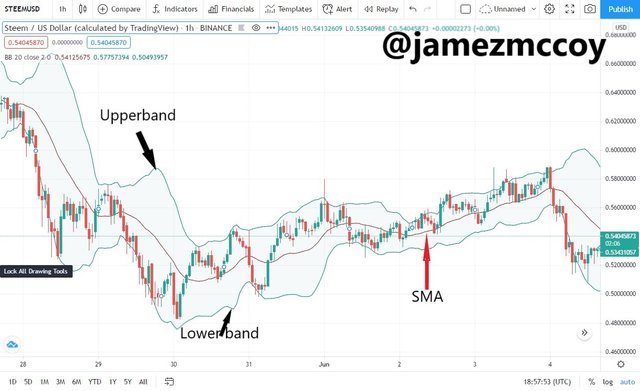
Bollinger band is an indicator created by a technical analyst John bolinger in the 1980s, it uses a moving average that is ussually placed in between 2(two) standard deviations which fluctuates according to markets volatility with time and has three notable lines upper band, SMA and lower band..
CALCULATION METHOD
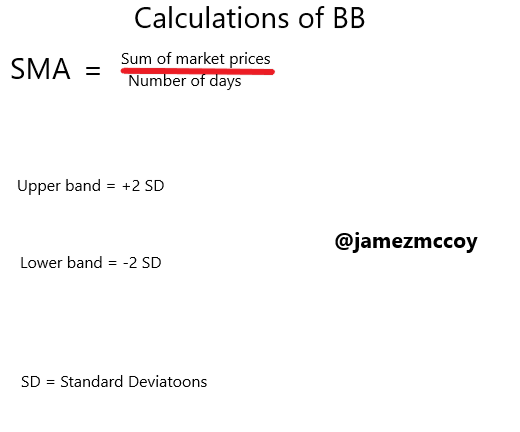
Bollinger Bands are are calculated using standard deviations from a moving average. Standard deviations measures the volatility of market using historical data often over 20 days but sometimes custom as an individual would want it maybe even months depends on choice of the individual making use of the data. These standard deviations are ussually plotted graphically in between two lines called the upper (with a +2 SD) and and the lower band (with a -2 SD)which indicates the 2 standard deviations from a 20days or custom moving average but custom days require custom standard deviations I will recommend one uses the usual 20days for easy understanding.1Standard deviations includes 68% of all data entries from the average while 2 standard deviations includes about 95% of all data entries.
HOW DOES IT WORK
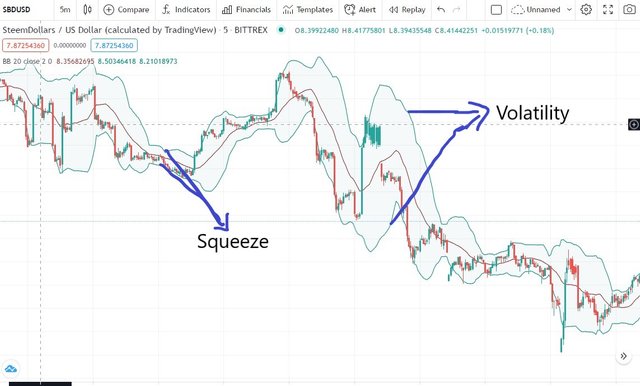
Bollinger band is built fundamentally on Standard deviations and is not that complex to grasp the way it works, you dont even have to understand how to calculate it to maximize its use you just need to understand its principles. It uses data to anticipate trends and indicates potential squeeze(a situation where the upper and lower band shrink Reducing SMA movement which indicates low volatility and potential increase in close future of market volatility). It consist of three lines where the market is expected to be stay within 90% to 95% of the time ussually when you see the simple moving average line go toward the upper band it means the market is over bought while the closer the prices(Simple Moving Average SMA) is to the lower band it means the market is over sold. In a nutshell what it does majorly is anticipate volatility
THE BEST BOLLINGER BAND SETUP
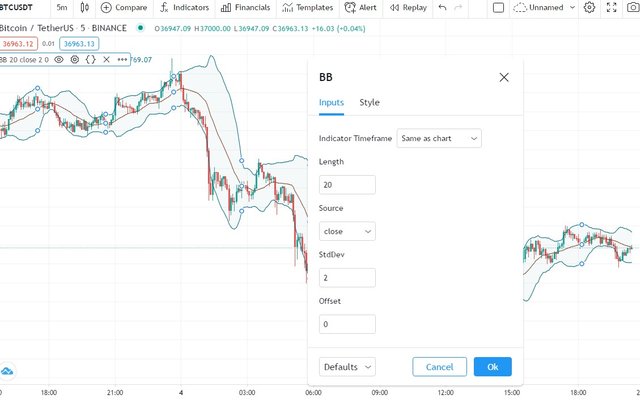
In my opinion the basic default it comes with is quite okay I.e where the SMA is being calculated over 20 days and the SD is at +2 for upper and -2 for lower band of course it is fully customizable but I ll highly recommend the default so as to make the technical indicator easy to understand and maximize profit.
How to setup Bollinger Band Indicator on Tradingview
Step 1
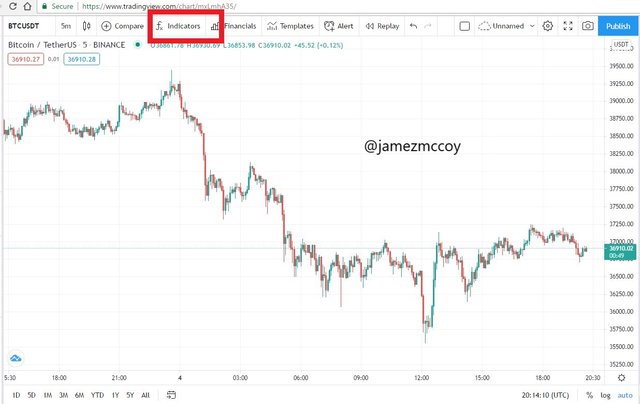
After you have successfully entered Tradingview on your browser it should open like this
Step 2
Click on the indicator
a
list would appear like this type in bollinger band and select
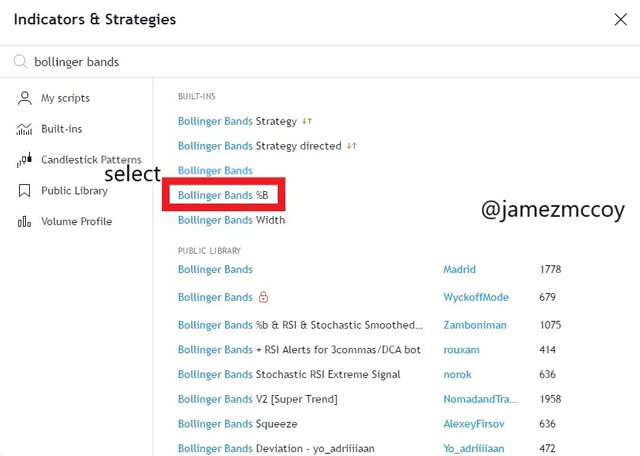
i
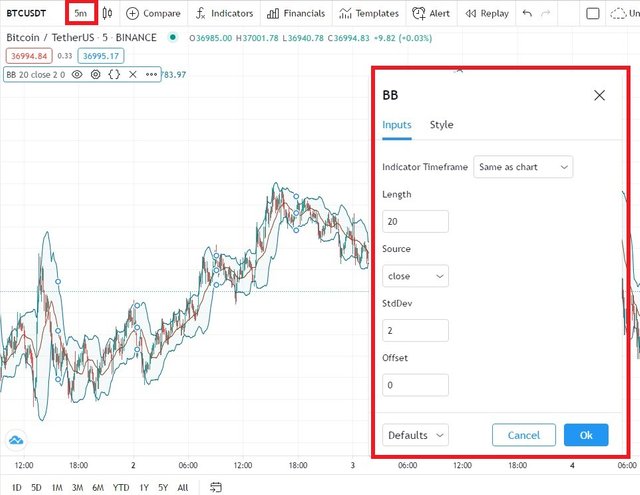
Your chart should look something like this
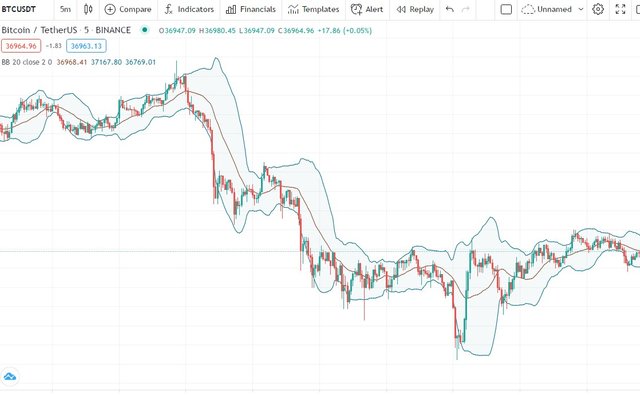
it has its default settings already set up
QUESTION 2
What is a breakout and how do you determine it?
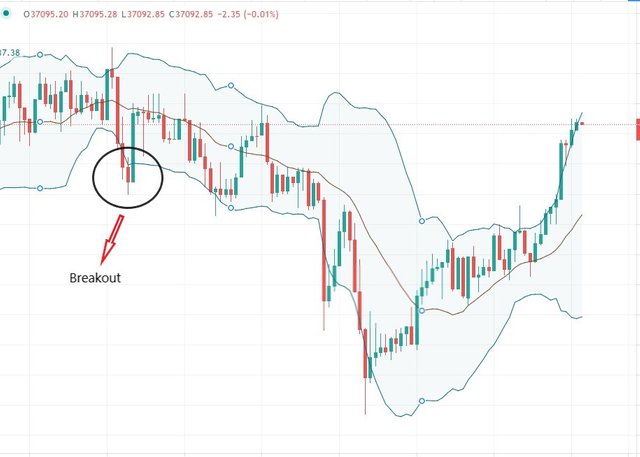
Around 90 to 95% of the time the Market price is expected to stay within the upper and lower bands, but in some cases not very often the SMA tends to move beyond the Support and resistance either above resistance or below the support and is mostly inspired by a major events, breakout are
- not indications to buy or sell
- it is not a signal
- it does not tell or indicate trends or direction market is moving towards.
- it simply means price has gone beyond Support and resistance level
SUPPORT AND RESISTANCE are created when market price tends to go up and down within certain range,the upper is called resistance while the lower is called support, to determine breakout is easily when the market trends goes outside this level.
QUESTION 3
How to use Bollinger bands with a trending market
In crypto market they are two types of trend, bullish and bearish - BULLISH TREND
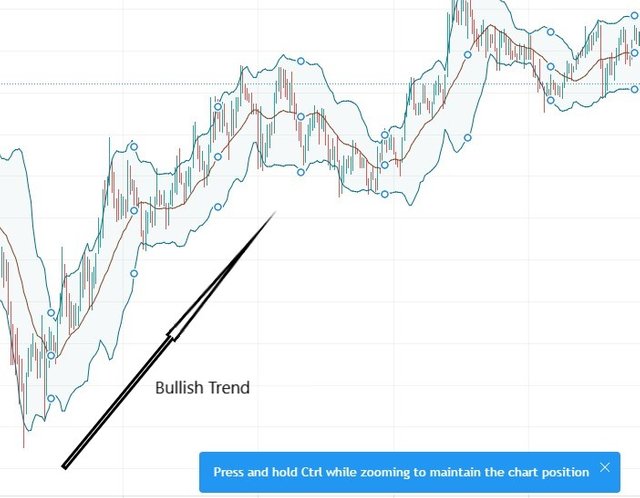
Bullish trend is seen when SMA/Market price is increases by atleast a minimum upgrowth of 20% or more I.e market price keeps increasing.This type of trend is ussually inspired or instigated by major market rally or major stock movement.
- BEARISH TREND
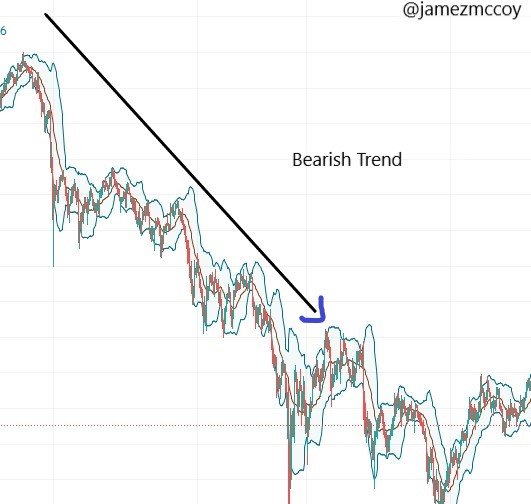
This type of trend is the total opposite of bullish trend and it is seen when SMA/Market price starts to fall in a down ward trend
Now in market trends the bolinger bands gives you an idea of market will be moving towards, bolinger bands deals much with volatility in so much that it indicates when they will be an uptrend or downtrend in the market, it is always best to use the 20 days average and set the default SD to 2 because we know that with this default setting the SMA is expected to stay within the band 95% of the time.Take a look at this screenshot
QUESTION 4
What is the best indicator to use with Bollinger Bands to make your trade more meaningful? (Screenshot required)
To ride a market trend properly and to maximize profit and reduce risk it is always advisable to use more than just bolinger bands as a technical indicator they are many more technical indicators one can use alongside bolinger bands for more accuracy in riding and maximizing from trends.
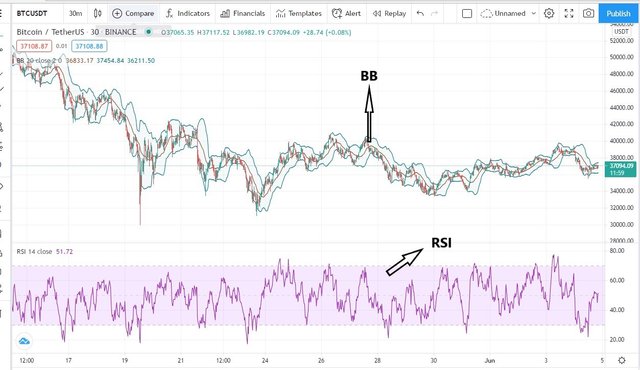
In my opinion the best combo to maximize profit from market trends is combination of Relative Strength Index and bolinger bands. Relative strength index helps you measure with some certain level of accuracy the momentum of market whether a market is over bought or over sold,it is calculated by dividing average gains/average loss. RSI is plotted on a graph of 0 to 100 and is in between two lines known as over bought and over sold.
So in my opinion the combination of Bolinger bands and RSI are is very effective, here is a screenshot of my mixed indicators
Here is what the combination of this two indicators look like
QUESTION 5
What timeframe does the Bollinger Bands work best on?And why? (Screenshots required)
I Honestly like I said earlier the best setting is the default setting that is 20days period and 2SD settings with a chart of 5M..But it all comes down to the type of strategy you are using, for short term traders it's best we use the default giving down below
And its important you use the 5 minutes chart so as to get a broader perspective of what's up in the market, but it all comes down to the type of trading you are into whether long term or short term so as a beginner I chose to research on what time frame works best and I concluded my research with a basic 5mins chart and default bolinger setting for quick profit intake
QUESTION 6
Review the chart of any pair and present the various signals giving by the indicator Bollinger Bands. (Screenshot required)
I will be reviewing the pair STEEM/USD on a 5 minutes chart on tradingview.com and currently when i took the screenshot the market appeared to be in a bit of a downtrend but the bolinger band seem to suggest that the market will go back to its norm
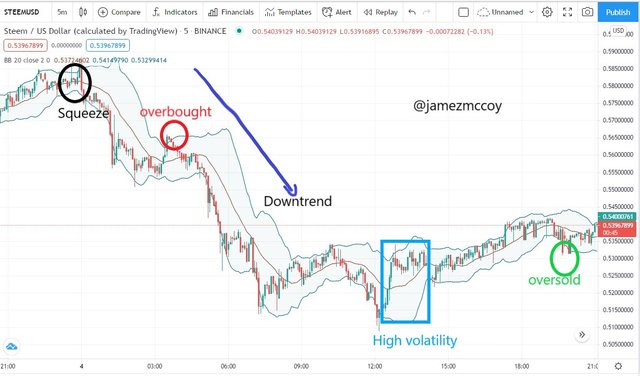
STEEM/USD
The bollinger Band gives of a lot of indications although not alll are indications to enter a trade or exit one it
Here is a list of indicatons Bollinger Band gives off
- Overbought
- Over Sold
- Uptrend
- Downtrend
- Squeeze
Conclusion
The bolinger band is a very powerful and explicit tool in the hand of one that knows how to manipulate it and understands how it works,but using the bolinger band alone might not be as effective or efficient as it would be if one mixes it with other technical indicators like RSI or Stochastic e.t.c , the combo of bollinger band and other indicators will give you a more insightful view of the market and one can maximize profit intake.
Knowledge is key to SUCCESS in the trading world special thanks to @kouba01 for his amazing lecture that was eye opening for me..Thank you so much and a good day to you all.....
P.S all images used in this article were screenshots from my PC
Hello @jamezmccoy,
Thank you for participating in the 8th Week Crypto Course in its second season and for your efforts to complete the suggested tasks, you deserve a 4/10 rating, according to the following scale:
My review :
Article with substandard content Your answers do not have a clear methodology and analysis of the information provided. This made the work lack depth and structure. Try reading some good articles to quote excellent writing styles.
Thanks again for your effort, and we look forward to reading your next work.
Sincerely,@kouba01
Thank you