Techinical Indicators :Crypto Academy / S4W2- Homework Post for @reminiscence01".by @jahangeerkhanday

Hello dear steemians ,how are you all?i hope you are are doing great .Today i am going to post my weekly homework task provided to us by professor @reminiscence and i hope you all find it easy and intelligible.Here i am answering the question that is
1.a) In your own words, explain Technical indicators and why it is a good technical analysis tool.
b) Are technical indicators good for cryptocurrency analysis? Explain your answer.
c) Illustrate how to add indicators on the chart and also how to configure them. (Screenshot needed).
2.a) Explain the different categories of Technical indicators and give an example of each category. Also, show the indicators used as an example on your chart. (Screenshot needed).
b) Briefly explain the reason why indicators are not advisable to be used as a standalone tool for technical analysis.
c) Explain how an investor can increase the success rate of a technical indicator signal.
QUESTION NO 1
a. IN YOUR OWN WORDS, EXPLAIN TECHNICAL INDICATORS AND WHY IT IS A GOOD TECHNICAL ANALYSIS TOOL.
Technical Indicators are the tools used to represent graphically the price movements over a period of time including past as well as future and thus help the users in predicting the market trends and the price of assets.Techinical indicators use the data of previous market prices and on the basis of this data predict the future market rates.Techinical indicators thus play an important role in generating signals to predict price of assets in cryptocurrency markets.
Techinical indicators help investors to analyze the market and in making the right decisions while trading.Techinical indicators generate buy and sell signals by using the market trends,predictions,buy and sell demands etc.
Technical indicators are versatile in functions. They provide a reason for the investors to have a faith in because when these techinical indicators are used together,they confirm the market trend predictions i.e one techinical indicator confirms the prediction made by the other.
b. ARE TECHNICAL INDICATORS GOOD FOR CRYPTOCURRENCY ANALYSIS? EXPLAIN.
Techinical indicators have a very significant role in cryptocurrency analysis as crypto markets are very volatile and prices of assets change very rapidly .These frequent changes in price become a reason of losing or gaining assets by an investor.So as to be on a safer side and not to lose any assets investors take help from these indicators.These indicators indicate the trends for any pair of assets and are thus equally available for any investor.
c. ILLUSTRATE HOW TO ADD INDICATORS ON THE CHART AND ALSO HOW TO CONFIGURE THEM. (SCREENSHOT NEEDED)
In this question I will try to show how a technical indicator can be added to a chart on tradingview.
Following are the steps involved.
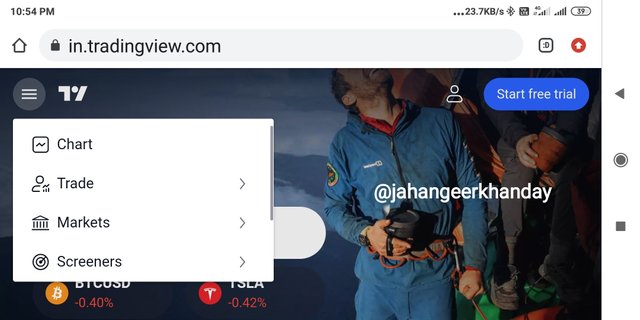
1.Firstly click on the link to open the website then click on charts shown on the screen.


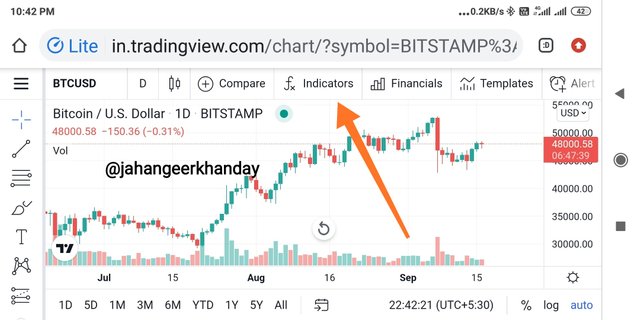
- Select a chart e.g BTC/USDT ,after it is displayed,click on the indicators denoted by (fx) symbol.
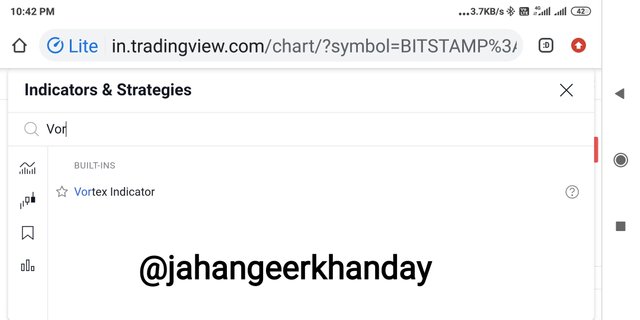
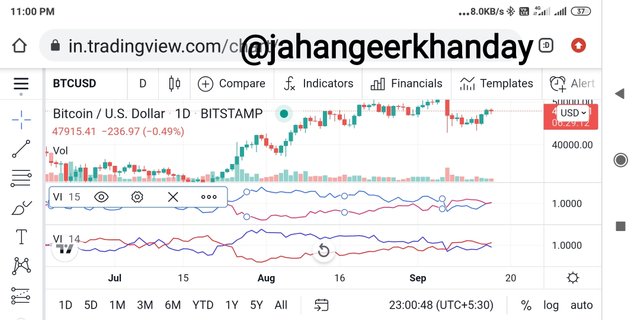
3.From the list of indicators , select your preferred indicator or search by typing the keywords in the search bar e.g vortex indicator.
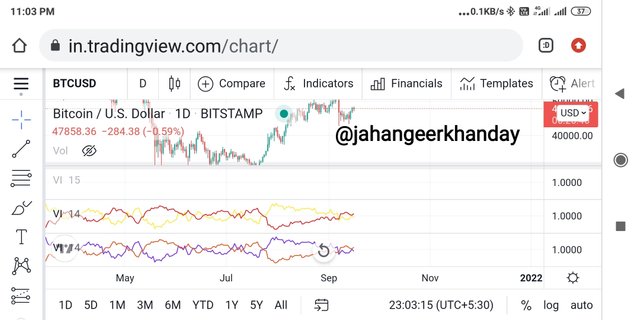
The vortex indicator on the chart is shown below.
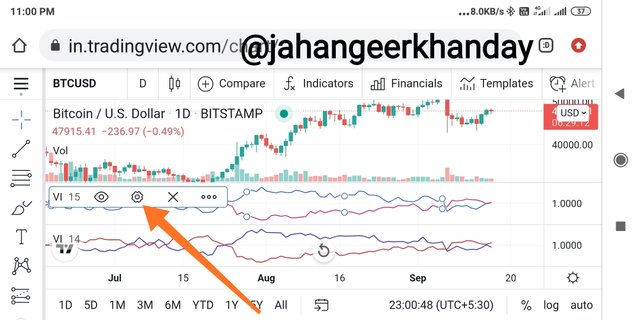
TO CONFIGURE A TECHNICAL INDICATOR.
I will try to configure vortex indicator that i added to the chart above.
Clicking on the settings icon from indicator menu shown in the screenshot below.
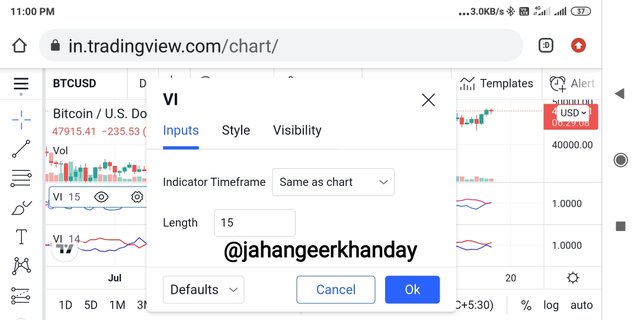
A configuring box will pop up with the options for length,we can change the length as per our will and may also set it at default i.e 14.
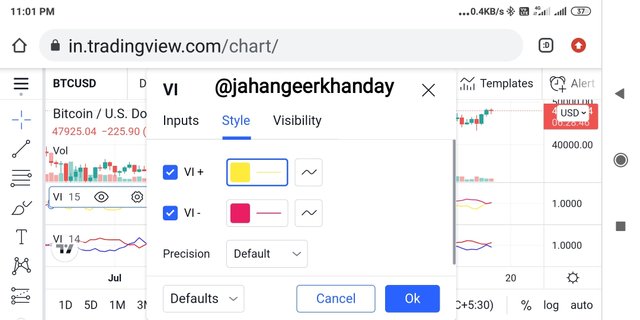
We can change the style of the indicator, I changed the VI+ to a yellow color and the VI- to red color.
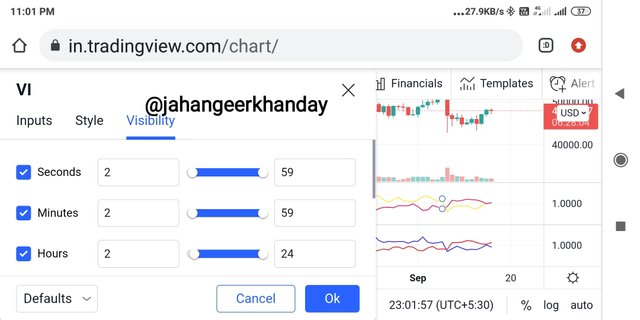
We can change the visibility of the indicator by changing the time duration as shown in the screenshot below.
This is the final configured vortex indicator shown in screenshot below.
QUESTION NO. 2
a. EXPLAIN THE DIFFERENT CATERGORIES OF TECHNICAL INDICATORS AND GIVE AN EXAMPLE OF EACH CATEGORY.ALSO, SHOW THE INDICATOR USED AS AN EXAMPLE ON YOUR CHART.
The different techinical indicators are
a).Momentum indicators.
As the name indicates ,momentum indicators are used to show how strong an existing trend is.It also locates market trend reversals that may occur in future.It can be concluded that a momentum indicator tells a trader when to take profit and when to hold an asset.Examples:Relative Strength Index(RSI),Stochastic indiactors.etc
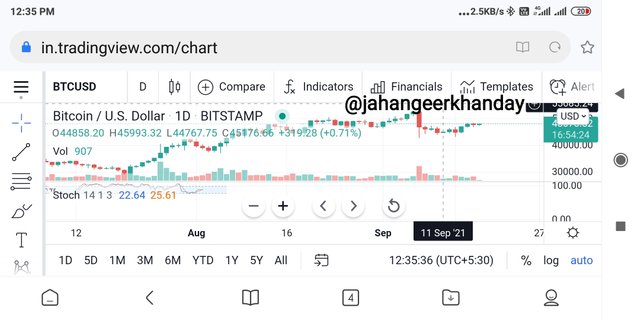
STOCHASTIC INDICATOR USED ON A CHART
b).Volatility indicator:
As the name suggests,this indicator indicates the volatility of an asset i.e how volatile its price is.In other words ,volatility indicators show the change in price of an asset in a certain period of time.Higher volatility means very frequent changes in price and vice versa.Example: Bollinger bands.
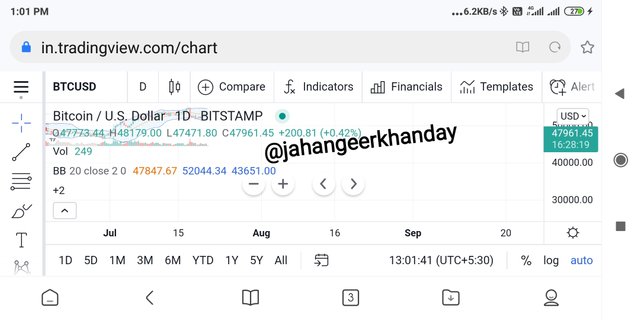
BOLLINGER BAND ON A CHART
c).Trend Indicators:
These indicators also do the same job as indicated by their name.Trend indicators are designed to show the trend of the market.Trend indicators shows the trend the market is in with the help of graph in the form of waves.Examples:Moving Average Convergence Divergence (MACD),Parabolic SAR.
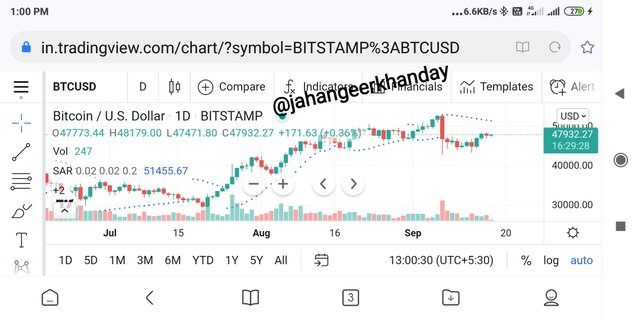
PARABOLIC SAR ON A CHART
d).Volume indicator:
We can guess the function of the indicator from its name.This indicator shows the change in the volume
of an asset over a period of time i.e how much volume of an asset is being traded in a certain interval of time.Example is On-Balance Volume indicator.
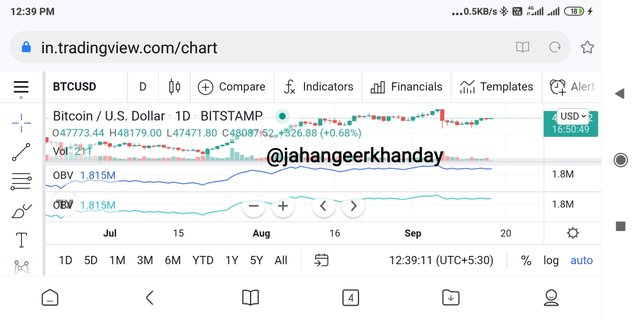
ON-BALANCE VOLUME INDICATOR USED ON A CHART
b. BRIEFLY EXPLAIN THE REASON WHY INDICATORS ARE NOT ADVISABLE TO BE USED AS A STANDALONE TOOL FOR TECHNICAL ANALYSIS
A single techinical indicator is not recommended and can become a reason of loss for an investor because these indicators work more effectively and accurately when used together.A single indicator shows only one parameter of the market and cannot determine the profit for an investor.It can give a misleading prediction.When various indicators are used together,a user can confirm the prefiction by comparing various parameters predicted by different indicators.
c. EXPLAIN HOW AN INVESTOR CAN INCREASE THE SUCCESS RATE OF A TECHNICAL INDICATOR SIGNAL.
An investor can increase the success rate by being very careful about how to use these indicators.Being careful means an investor needs to use multiple indicators and that too of different types so that comparison and prefiction become easy and fruitful.One more important thing to be successful regarding these techinical indicators is that an investor must have the knowledge of these parameters that these indicators predict and the investor must have a proper understanding of these indicators.
Thank you dear professors ,it is only because of you that i was nil at the bottom in terms of knowledge related to cryptocurrencies now feel very comfortable while talking about cryptocurrencies and all.You people have always been kind and simple in making us understand the subject.Thank you once again.
Hello @jahangeerkhanday, I’m glad you participated in the 2nd week Season 4 of the Beginner’s class at the Steemit Crypto Academy. Your grades in this task are as follows:
Recommendation / Feedback:
Thank you for submitting your homework task.