Steemit Crypto Academy Season 5 Beginner's Course - Task 10: Candlestick Patterns.

1a) Explain the Japanese candlestick chart? (Original screenshot required).
b) In your own words, explain why the Japanese Candlestick chart is the most used in the financial market.
c) Describe a bullish and a bearish candle. Also, explain its anatomy. (Original screenshot required)

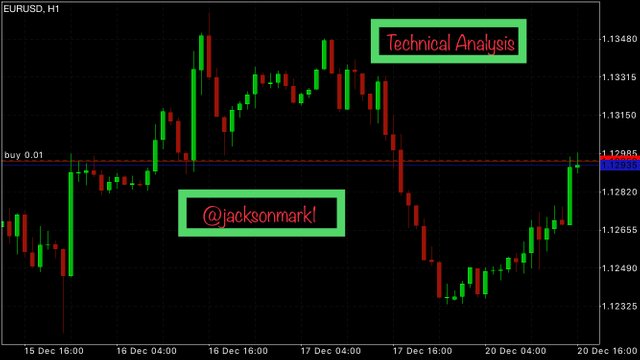
The Japanese candlestick chart is one of thr technical analysis chart used by traders in the financial market. It is the price of an asset represented in a graphical chart. This candlestick chart is created by the reciprocal actions taken by the buyers and sellers on a particular asset.
The Japanese candlestick chart was developed back then by an ancient Japanese Rice trader called Munehisa Homma in early 1700s. Based on his understanding for supply and Demand , he was focused on studying the price movements and how the markets is affected by this movements, which he succeeded in the development of this Foundation candlestick charts.
Candlestick charts plays an exceptional role in predicting a good technical analysis, it has a very vital meaning to traders, indicating notable market price point history and indicating at the later movements of price.
This candlestick charts also plays an exceptional role in the cryptocurrency market trading as it helps point out the price controller and thoughts between the buyers and sellers.
Japanese candlestick chart is a global tool used frequently by investors and traders all round the globe because of its system that give traders and investors the required information about price movements in the market through a graphical pattern.
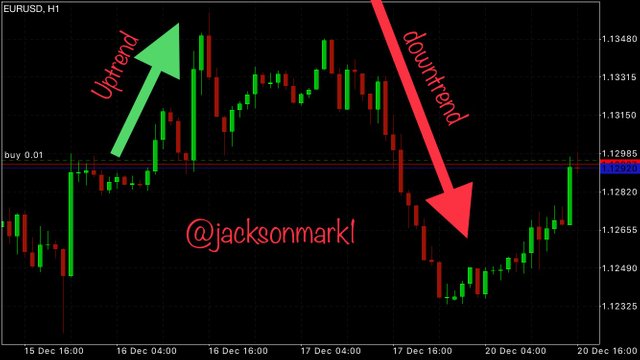
The Japanese candlestick chart has a simple and easy interpretable graph that tells us how the market price changes before we decide on how to place a trade order (buy or sell) in the market for a particular asset. With the Japanese candlestick chart, we can understand the upward and downward movements of market assets.
This chart is being used by both the beginners and experts traders in the financial market because it has different trading instruments that helps the traders predicts price movements in the market. It provides us with the data about the different currencies and assets tradable on a daily.
It gives the traders and the investors the necessary data on price openings, closings, price high and lows. This tools is best combined with technical indicators to facilitate and interpret the market trend in a particular period.
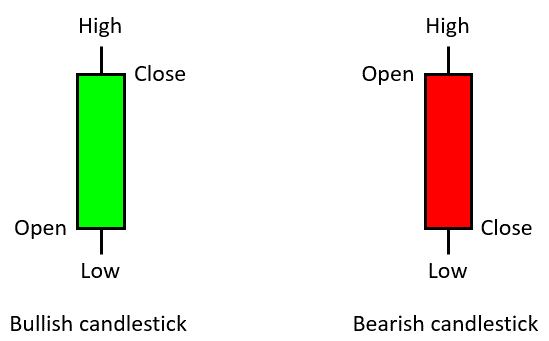
BULLISH CANDLESTICK
This is the green color candlestick as shown on the photo above, it represents the upward movements of a particular asset in the market (the buying movements). It is the candlestick that have a close end at the top level than it’s original open price level.
This candlestick creates awareness to the traders that the price is about going uptrend (go Bullish) after its former state in price. It is a reversal pattern that signals that the market is about to go bullish and can even push up the price further.
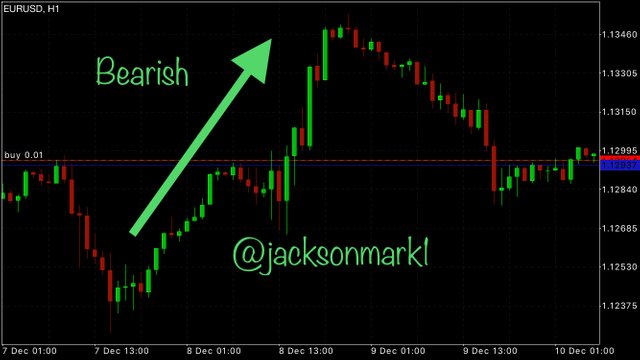
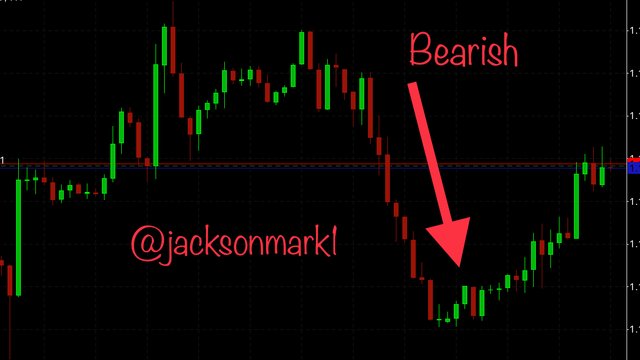
BEARISH CANDLESTICK
This goes in opposite direction to Bullish (goes against the Bullish movements), this candle indicates an upward (uptrend) is changing to a future bearish position.

1. Colors
BULLISH: it carries a green color which indicates that the market has risen in value parallel to its opening point.
BEARISH: It carries a Red color by nature (before in older it was identified by black). When the color red is formed in a chart, it means the market is on a selling direction or lost value.
2. BODY
- It’s vertical in nature, it represents the difference that a market has possessed in a given session. Short candles indicates that the stocks are remain calm, if the candle is long, it indicates a strong and active change in price(large green candles shows a considerable rise in market which is controlled by buyers, Large Red candles indicates that the market is controlled by sellers).
3. SHADOWS
- This lines are demarcation for the difference in high and low prices, with regards to the opening and closing sessions.
4. MAXIMUM or HIGH PRICE
- This indicates the most expressed appreciation reached by the monetary value in the course of a particular day. It isn’t validated by noticing the upward shadow on the candle, regardless if it’s upward or downward.
5. MINIMUM or LOW PRICE
- This indicates the downward price at which the monetary or financial value has extended to.
6. OPENING PRICE
- This shows the price at which the assets starts at evaluated day.
In Bearish candlestick, the opening price is reflected at the top of the candle while the Bullish candle opening price is reflected at the bottom of the candle.
7. CLOSING PRICE
- It is the estimate that shows the last value at which the stock/market close of the estimated product. This candle is represented at the top of the candle if its Bullish and show at the bottom of it goes Bearish.

After the whole lecture given by the professor @reminiscence01, I’ve been able to learn more about crypto currency and how trading can be done, also I’ve been equipped with the basic knowledge on how to begin a trade as a beginner.
Thanks so far for going through my task 10 post.
