[Crypto Trading with Price Action] - Crypto Academy / S6W2- Homework Post for @reminiscence01
My name is Imantha and I'm from Sri Lanka. This is my first time participating in the steemit crypto academy homework series. I hope to learn lots of new things about crypto and trading from these homework series. Thank you everyone who takes their time to make this course series happen. I would like to thank @reminiscence01 for giving us this homework.

What is price action?
Price action helps us to understand the current market condition by looking at past price movement. Then we can predict the direction of the market to make a profit. Areas of high demand and supply, risk management, and psychology of traders can not be identified by the fundamental analysis. So, lots of traders lose their positions because they only rely on fundamental analysis.
Price action uses the chart patterns, support, and resistance, volumes, market structures, technical indicators to predict the direction of price. So, this makes trading decisions much more accurate. Price movement is a result of the emotions and psychology of traders which we can see in the charts. For example, when a double top pattern is created on a chart, it usually becomes a bearish trend. So, traders can enter into good positions using this knowledge.
In spot trading, when comparing the historical data, we can enter into good buying positions. In leverage trading also, this can be done by studying short term price trends. So as we can see, the price action is really important. But it is important to know that price action alone, can not survive in every situation. We should understand the fundamental factors also. Events like major news will show the high volatility of this crypto market. So, understanding this is really important.
What is the importance of price action? Will you choose any other form of technical analysis apart from price action?
By using the price action, we can identify key price information and current market trends. We can identify the areas of high demand and supply. Identifying those things will help us to predict the future price of an asset very easily.
By understanding the emotions of traders using patterns on the chart, we can predict the future price. Traders' emotions and psychology can be seen in a double top formation. So, this can be a huge opportunity for us to enter into a trade.
As we all know, the market is controlled by big investors. So, we can be easily fooled by them. So, by using the price action with historical data, we can stay safe. Markeys like ranging are very tricky, price action helps us to remove the noise with it and show us the right way.
Price action can be applied to any market and any trading strategy. So I use price action with a combination of other technical analysis tools. Using only one strategy will not make us successful. So, focusing mainly on price action with the combination of other tools are really important.
Explain the Japanese candlestick chart and its importance in technical analysis. Would you prefer any other technical chart apart from the candlestick chart?
If you only use numerical data, can you imagine how hard it is to understand the market behavior? That’s why different types of charts do a major role when showing different market price actions. The Japanese candlestick chart is one of the most important chart types that we can make use of to trade successfully.
The candlestick charts are commonly used in the financial market these days because it is preferred over other charts due to some unique features. It helps to visualize the human behaviors and psychology of traders on the chart. The candlestick charts display the actions of demand and supply of an asset over different time periods.
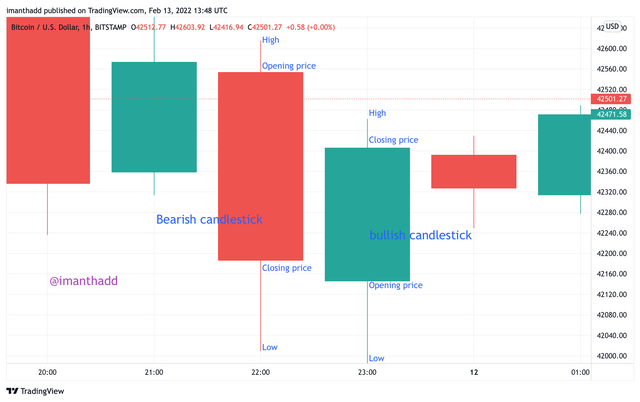
There are 2 types of candles. The bullish candle is shown in green color default. It means the closing price of that candle is higher than the opening price of the candle. The bearish candle does the opposite. It shows in red color and the closing price is lower than the opening price of the candle related to the relevant time period.
What do you understand by multi-timeframe analysis? State the importance of multi-timeframe analysis.
Multi timeframe analysis is really important to understand the trend of the market. We can use longer timeframes like, day, week or month to identify the market trend. Small time frames like, seconds, minute, hour are used to enter a good trading position. Similarly, a scalper will focus on the 1hour, 30mins, and 15 minutes for trade setups. Then he can go down to 5 mins and 1minutes charts for entry positions. As you can see, the multi timeframe analysis plays a major role here.
The candle charts are enriched with lots of information Sometimes those are too much for a trader. So, the multi timeframe analysis is really helpful to cancel the noise of the market. We can identify possible entry points using multi timeframe analysis. For example when an inverted hammer was formed we understand that we can enter into market time placing proper stop loss. A wide stop loss is also a weak point. So, this multi time frame helps us to tighten up the stop loss and trade effectively.
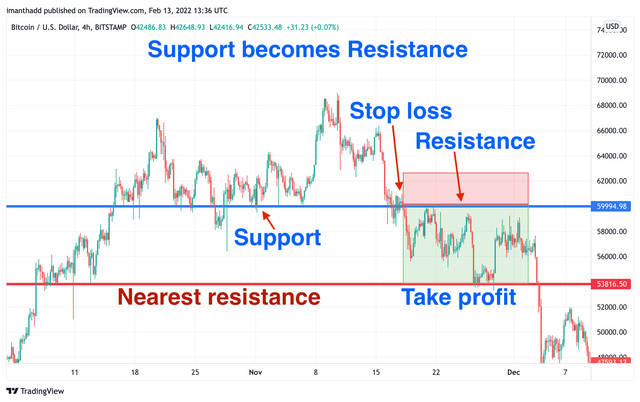
With the aid of a crypto chart, explain how we can get a better entry position and tight stop loss using multi-timeframe analysis.
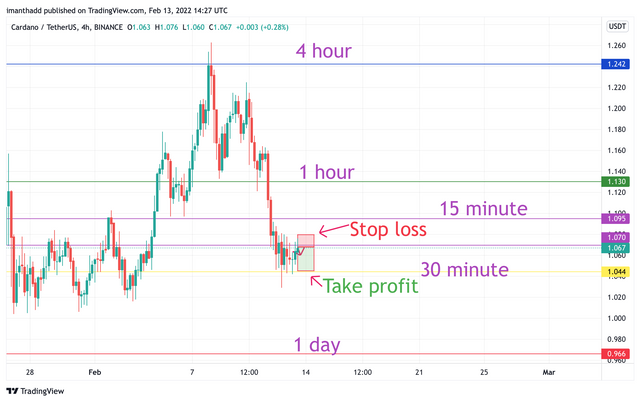
As you can see in the image below, i marked necessary support and resistance lines using the 1 day, 4 hour, 1 hour, 30 minutes and 15 minutes charts. Then i identified possible short (sell) position in the chart and decided to enter to a short position. As you can see there, i marked the stop loss and the take profit regions also.
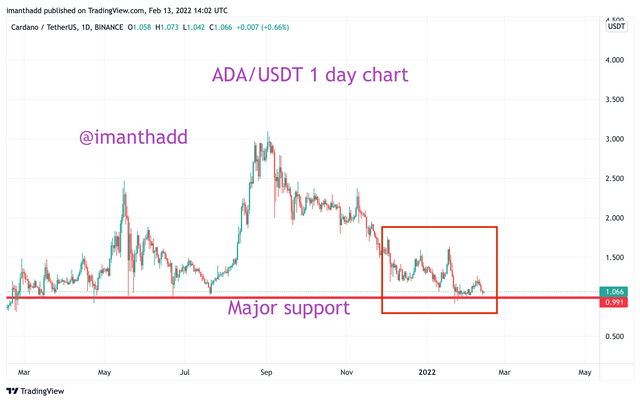
Carry out a multi-timeframe analysis on any crypto pair identifying support and resistance levels. Execute a buy or sell order using any demo account.
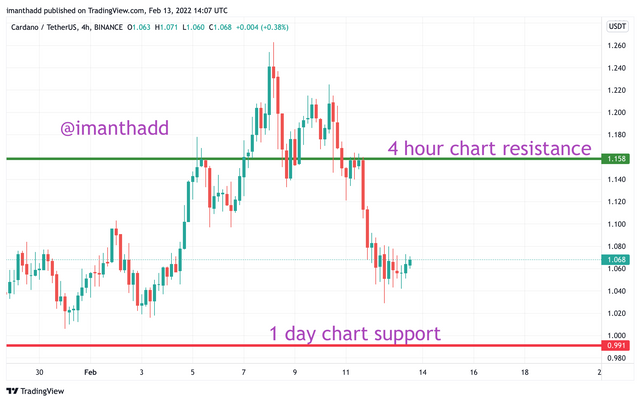
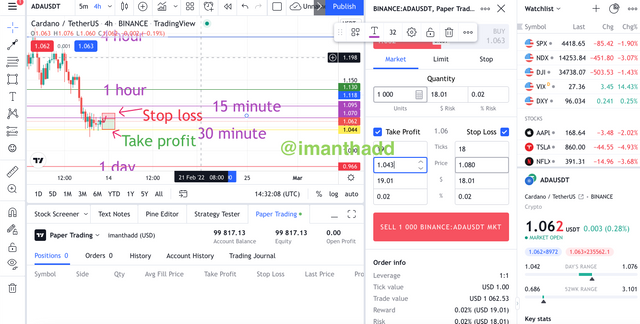
Here in the first image i have shown you how i created a sell order using ADA and USDT. I entered the order marking take profit and stop loss levels.
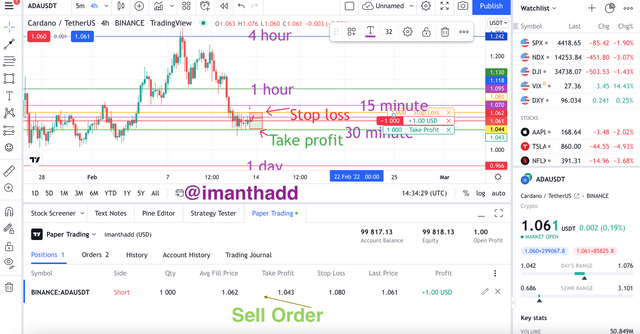
Here in this image you can see now my order is live and profitable. When it hits the take profit level, it will automatically close my order and will gain profit. Let's see.
Conclusion
Overall this homework gave me a very clear picture about the basics of crypto trading with price action and different techniques. I would like to thank crypto professor @reminiscence01 again for giving us this homework and nicely explaining those concepts.