[Crypto Trading Using Zig Zag Indicator]- Crypto Academy /S6W1-Homework Post for @kouba01
My name is Imantha and I'm from Sri Lanka. This is my first time participating in the steemit crypto academy homework series. I hope to learn lots of new things about crypto and trading from these homework series. Thank you everyone who takes their time to make this course series happen. I would like to thank @kouba01 for giving us this homework.
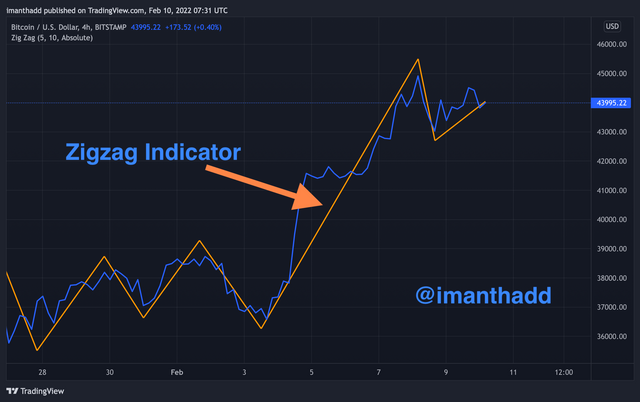
What is ZigZag trading indicator and how it is calculated
When trading, looking at the price action is very important. Finding out the uptrend or downtrend is really useful. We use different types of indicators with our trading view software to get a better picture of the price action using those various indicators. The Zigzag indicator is very useful for us to identify a major price trend change. It gives us a signal when the price trend changes. So this is very useful.Because of those mentioned properties, the Zigzag indicator is used by lots of traders with a combination of various trading strategies.
The Zigzag indicator determines minimum and maximum on the price chart and connects them with lines. We can see a clear picture of the price action, free from distractions and small factors because small price movements are removed here. So, this is effective on all crypto assets and for all time periods like seconds, minutes, hours, days, weeks, months and years.
The ZigZag indicator works using the following algorithm. First it finds the lowest price in the depth interval. Then If the trend is moving down, the line moves when it exceeds the deviation distance. So,a redesign happens when modifying the settings of this parameter. If the price trend goes up, the indicator starts looking for a maximum in the depth range.If the price rises further, the line moves when the deviation interval is overcome and it will be drawn again. The cycle repeats when the time axis moves.
Depending on the chart type we use, the Zigzag indicator takes different input parameters. As an example, it takes the closing price when we are using the line charts. The important thing to remember is that it can not predict the last segment correctly because it is constantly changing. Since the price is changing with time, the last segment can be changed. So, when we do analysis, we should not take the last segment into account.
Main parameters of the Zigzag indicator and How to configure them
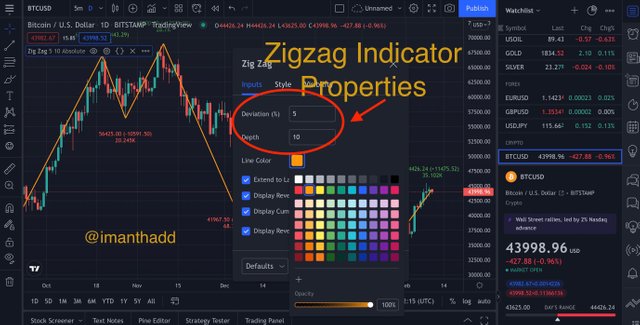
There are two parameters in the Zigzag indicator. The first one is deviation and the second one is depth. The depth can be customizable according to the situation with our trading view software. But the deviation parameter is always set to 5.
The deviation parameter is the minimum price change that must have a maximum/minimum from the previous maximum/minimum for the ZigZag to identify a new high value (peak). It usually expresses as a percentage and is fixed at 5.
The depth parameter is the minimum distance when using candle charts in which the indicator will not represent a new maximum/minimum that is different from the previous one by a value at least equal to the "Deviation". It is normally set to 10.
Identify the price trend and buy/sell points
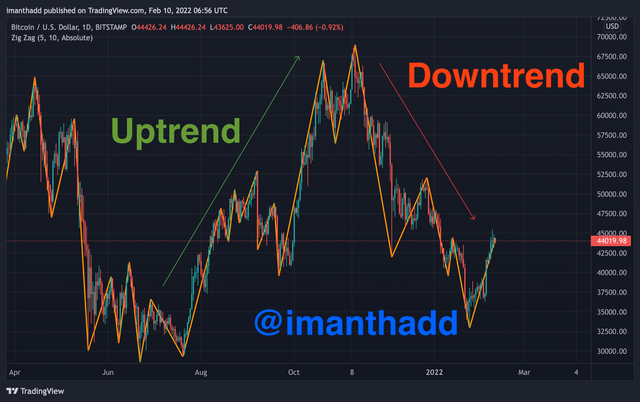
When the Zigzag makes highs in ascending order, we can see that the price is in an uptrend. Likewise, when Zigzag makes lows in descending order, the price is in a downtrend. We can make a buy order in an uptrend when the price makes the next low higher than the previous low, the Stop Loss is below the nearest low. We can make a sell order in a downtrend when the price makes the next high lower than the previous one, the stop loss is above the nearest high. Setting a stop loss is really important to avoid unexpected profit losses.
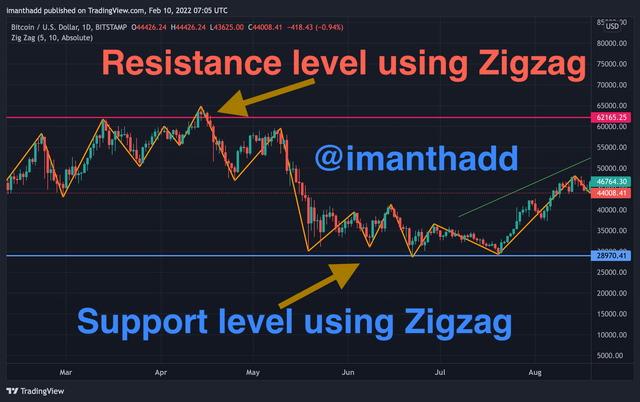
Identify the Resistance and Support levels using the Zigzag indicator
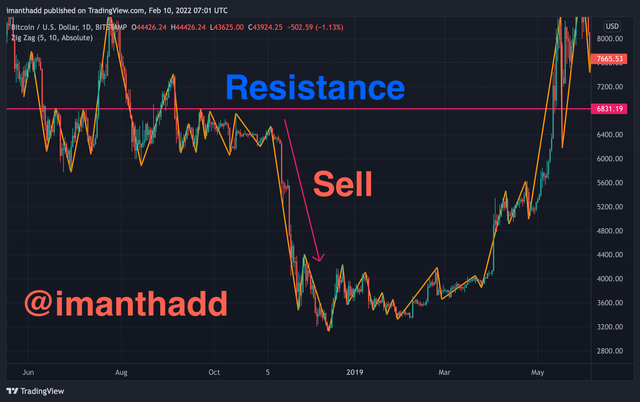
When the Zigzag indicator makes horizontal highs, it can be identified as a resistance level. When the Zigzag indicator makes horizontal lows, it can be identified as a support level. As we can see, we can identify the support and resistance areas using the Zigzag indicator. Since the price is moving and rotating near these areas, we can use those to make a prediction and enter into a trade. But we should be aware that the Zigzag indicator is not a perfect one.
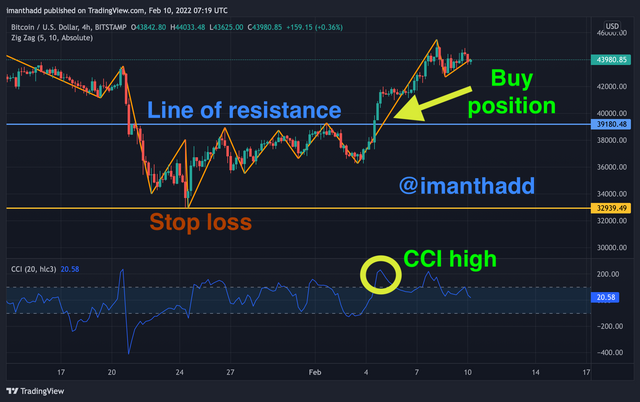
Strategy with Zigzag and CCI
The CCI indicator makes us understand if there is tension on the buyers' or sellers' side. So using it with a zigzag indicator can be very helpful to enter a long or short position. We receive a buy signal when there is a breakout of the last maximum value of the zigzag and at the same time the value of the CCI exceeds 100. The entry value is that of a breakout of a point of the highest value of the Zigzag. Instead, we receive a sell signal when there is a break in the last minimum value of the zigzag and at the same time the CCI value will be below -100. The entry value is that of breaking a point of the lowest value of the Zigzag.
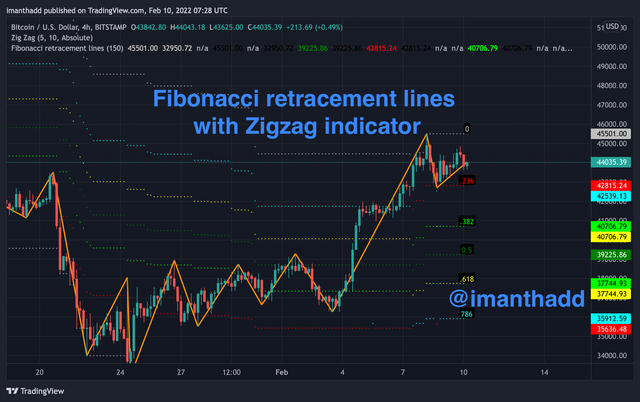
The combination of the Zigzag tool with the Fibonacci retracement tool
In order to take advantage of any fluctuations that occur during market phases with well-defined trends, we use this combination of the Zigzag tool with the Fibonacci retracement tool. The Fibonacci is drawn using a maximum/minimum peak of a ZigZag. The start and the opposite peak of the same ZigZag as the term. Fibonacci retracement trading technique is used with a combination of Zigzag indicators to enter and exit from the market.
Advantages and Disadvantages of the ZigZag indicator
- It can analyze the most significant trends without market noise.
- We can use various time intervals.
- We can use it with a combination of various other indicators such as CCI and Fibonacci retracement tools to get a better use of it.
- It can efficiently work with Eliot waves.
- The last section of this indicator is always changing and will be redrawn.
- The complexity of forming an objective prediction.
- Only suitable for high timeframes.
Conclusion
Zigzag indicator is very useful for traders to identify the price trend. It’s most suitable for analyzing past price movements rather than doing trend predictions. That is because the last section of this indicator can be changed because of the price movement. Zigzag indicator shows the formation of a new Elliott wave, works well with Fibo levels, identifies the price trend, and chart shapes. So therefore, knowing this indicator gives traders a huge advantage.

