Crypto Academy Week 8 Season 3 Homework Post for @asaj [Crypto Assets and The Random Index (KDJ)]

We meet again on homework for the 8th week of Steemit Crypto Academy. This time I will make a post for the homework of @asaj. The task this time is to answer several questions that have been given by the professor about Crypto Assets and the Random Index (KDJ).
What Is Random Index and How Is It Calculated

1. What is Random Index
Random indicator or often referred to as KDJ is an indicator that is often used by traders from all over the world to observe trends that are happening in the market. By knowing the current trend in the market, traders will find it easier to determine entry and exit points so that they can benefit by following the ongoing trend.
As the name suggests, the KDJ indicator is an indicator consisting of 3 different lines, each of which is named K-Line, D-Line, and J-Line. The movement of these three lines will vary depending on market conditions at that time, but the 2 lines called the K-Line and D-Line have movements that are similar to the stochastic oscillator lines where these two lines describe the movement of buying and selling prices. Meanwhile, what distinguishes this indicator from the Stochastic Oscillator is the addition of the last line, the J-Line.
J-Line is a line that is made as a differentiator between K-Line and D-Line which can help traders to see the movement of trends that are in the divergence stage. As we know that divergence is a moment where market price movements are against the indicator, so when this is happening the J-Line will play an important role which will tell traders that the ongoing trend will reverse direction.

2. Calculating Random Index (KDJ)
Because KDJ is an indicator consisting of 3 lines, there are several formulas that we must look for in order to find out how the KDJ indicator works. But before starting to look for the value of one of the 3 lines, we must first calculate the Reserve Value (RSV) value.
Calculating Reserve Value (RSV)
- RSV = (Cp - Lp) / (Hp - Lp) x 100
Where:
Hp: Highest Price
Lp: Lowest Price
Cp: Closing Price
Calculating K-Line values
- K = (2/3 x previous K value) + (1/3 x RSV)
If the previous K value is not found, it can be made to 50.
Calculating D-Line values
- D = (2/3 x previous D value) + (1/3 x K)
If the previous D value is not found, it also can be made to 50.
Calculating the value of J-Line
- J = (3 x D) - (2 x K)

Is The Random Index Reliable?
Random Index (KDJ) is an indicator, the thing we have to stick in our minds is that there is no single indicator that can produce 100% accuracy from the technical analysis that we have made. This can happen because each indicator has its own advantages and disadvantages, just like the KDJ indicator, it can indeed provide traders with entry and exit signal information about trend price movements so that traders can enter at the ideal price. However, there are not a few incidents where KDJ gives false signals that make traders fail in trading.
Even so I can mention that KDJ is an indicator that can be used for trading, but there are things that must be considered here, to maximize the performance of KDJ, I advise traders to add some other auxiliary indicators so that they can be more sure of the signals given by KDJ , these indicators can be like ATR, Moving Average (MA), ADX, etc. Combining several of these indicators will make us more confident in making decisions based on the KDJ indicator.
Putting a Random Index on the Chart
Now I will show you how to add the KDJ indicator to a cryptocurrency chart, this time I will demonstrate it on the TradingView platform using the ETH/USDT Chart.
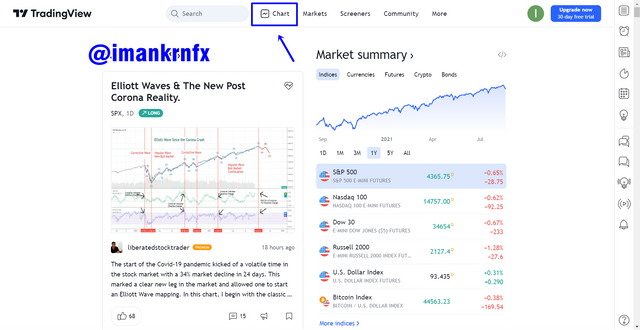
The first step is that you first go to the TradingView website and enter the Chart menu above the TradingView start page.
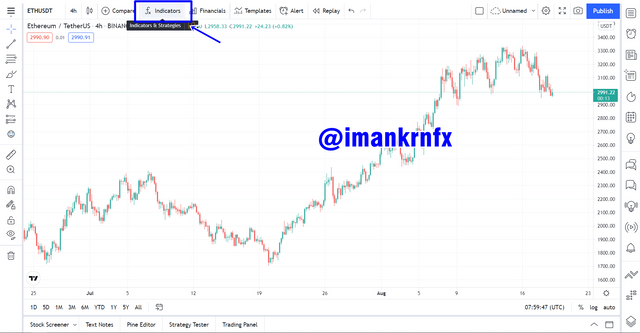
After that a chart will appear, we will choose one of the options at the top of the chart called "Indicators".
Type "KDJ" in the search field, then there will be several available KDJ indicators, we will choose the KDJ indicator made by ll21LAMBOS21.
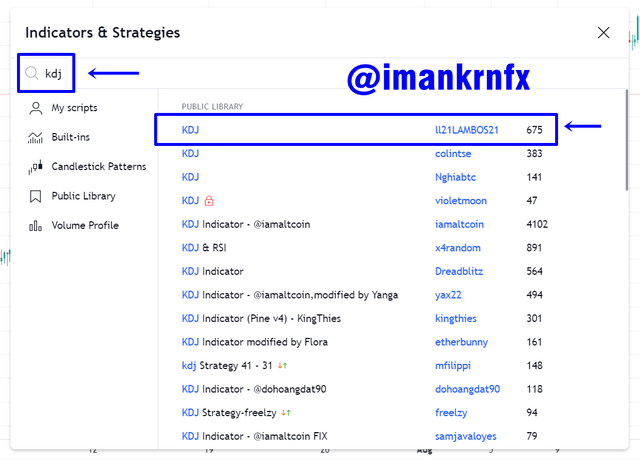
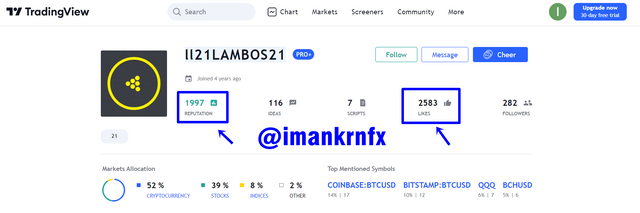
I chose the KDJ indicator created by ll21LAMBOS21 because it already has a reputation of almost 2000 and is liked by 2583 people. This is enough to make me sure to use this indicator.
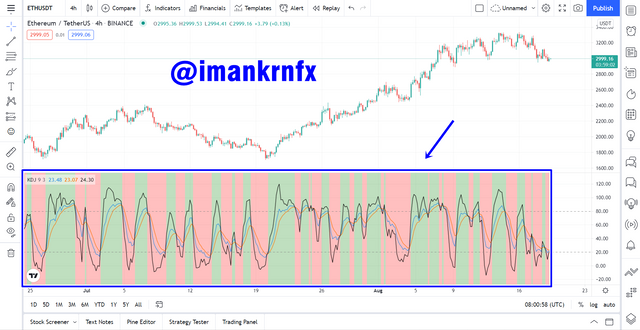
After we select the indicator, it will appear below the chart. We can see that on KDJ there are areas with green and red colors. The green color indicates that at that time the trend is experiencing a Bullish trend and it is recommended to make a purchase. While the red area indicates the trend is experiencing a Bearish trend and it is recommended to sell cryptocurrency.
Recommended Parameters
KDJ is an indicator shown for short period timeframe traders, and the best parameter for traders of this type is to set the period at 9 and the signal at 3. This is actually already set by ll21LAMBOS2 on the KDJ indicator that has been made by him. The number 9 in the period is the right number because the indicator will get enough signals with a false signal level that is not too extreme, so these meters are very suitable for short and mid term traders.
However, if you prefer to trade with a faster time then you can reduce the period to 7 or 6 so that the signals you get will be more and this time you can make more trade entries.
Differences Between KDJ, ADX, and ATR
In addition to the KDJ indicator, there are other indicators related to market trends, these indicators are ADX and ATR.
Average Directional Index (ADX)
This indicator is an indicator that shows the strength of a market's trend, in contrast to KDJ which can give a signal to change the trend from bullish to bearish or vice versa.
ADX only shows whether the trend in a period is in a strong or weak level so that the number of lines shown is only 1. To see the strength of the trend of an ADX market, use the 0-100 number range, if the ADX value is at a low value then at that time it is trending. is weak or even there is no trend at all, then if the ADX value touches a large number then the current trend is high.
The trend ranges for the ADX indicator are as follows:
- 0 - 25 : Weak Trend / No trend.
- 25 - 50 : There is a trend.
- 50 - 75 : Strong trend.
- 75 - 100 : The trend is very extreme.
Average True Range (ATR)
ATR is an indicator that shows the volatility of a market over a period, just like ADX it also doesn't show if a trend changes from bullish to bearish or vice versa as KDJ can do.
ATR has only 1 line that shows the rate of change in the price of a market. Traders usually use this indicator to determine when they will start entering or exiting a cryptocurrency trade, this indicator is very suitable for scalping tipped traders because the readings are relatively fast in just a few minutes.
The ATR value is shown with a number range as well as ADX. If the ATR value is showing a large number, it can be said that at that time the level of volatility in the market is high, whereas if the ATR value shows a small value, then the volatility level is decreasing.
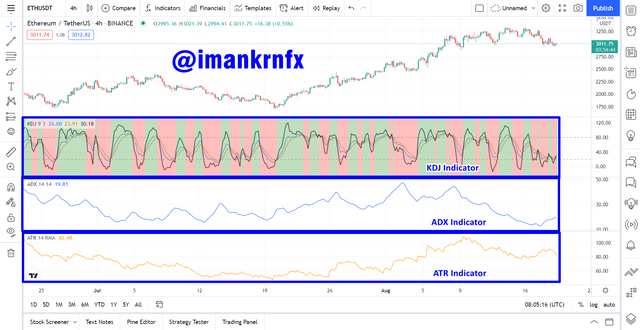
So that you can more clearly understand the differences between these three indicators, please look at the example graphic image below which displays these three indicators at once.
Buy and Sell Two Cryptocurrencies Using Random Index
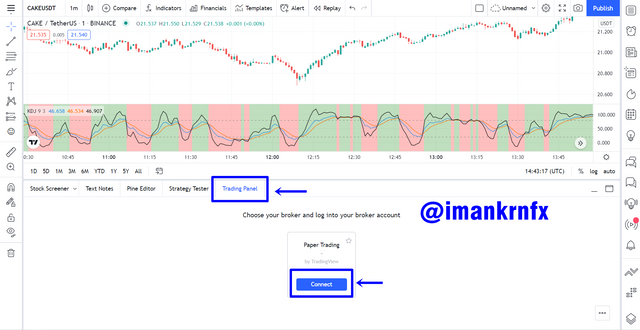
Now I will give an example of how to use the KDJ indicator in trading, for this example I will give an example using a demo account that can be accessed directly on TradingView by selecting Paper Trading at the bottom of the chart.
There are 2 types of entries that I will practice, namely buy entries and sell entries, both of which I will demonstrate using 2 different cryptocurrencies, including: Pancake (CAKE) and Chainlink (LINK). Both will use the same timeframe of 1 minute so that the trading process can run quickly.
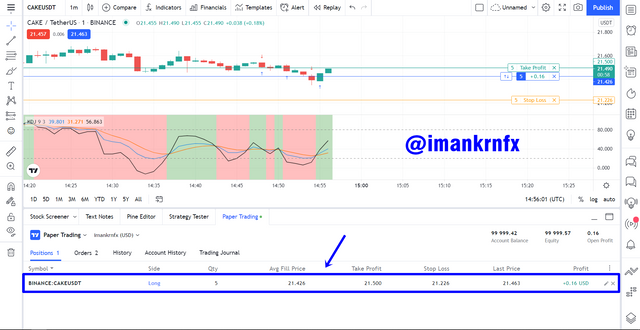
1. Trade Entry CAKE/USDT on Buy Position
The first thing I look at before deciding to enter a trade is how the market is doing. We can see in the chart below through the KDJ indicator that the CAKE coin has started to oversold and the J-Line has started to intersect with the K-Line and D-Line, this indicates that the trend will change direction from Bearish to Bullish.
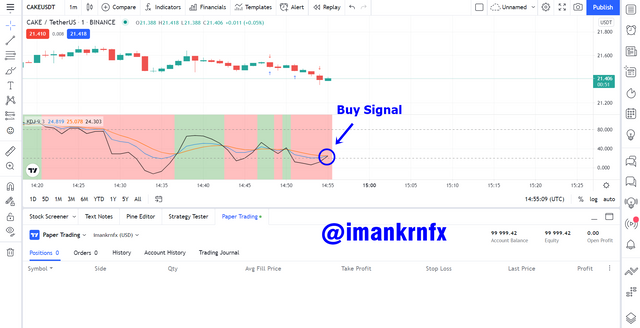
After that I made a long order with an indication that the price of Cake coins will increase in the future. I made a buy order with the following details:
- Quantity: 5.
- Entry Price: 21.426 USDT.
- Take Profit Price: 21.500 USDT.
- Entry Price: 21.226 USDT.
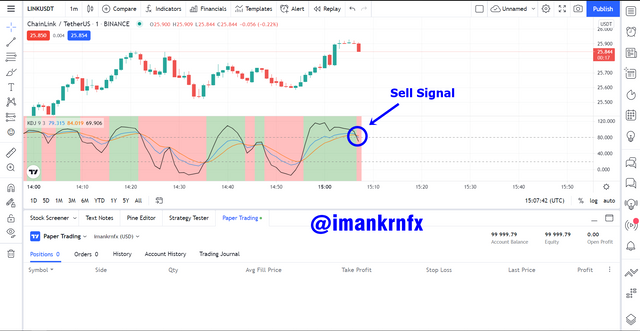
2. Trade Entry LINK/USDT on Sell Position
Unlike the previous CAKE coin chart, the LINK chart shown below shows that the LINK coin has started to overbuy and the J-Line has started to intersect with the K-Line and D-Line, this indicates that the trend will change direction from Bullish to Bearish.
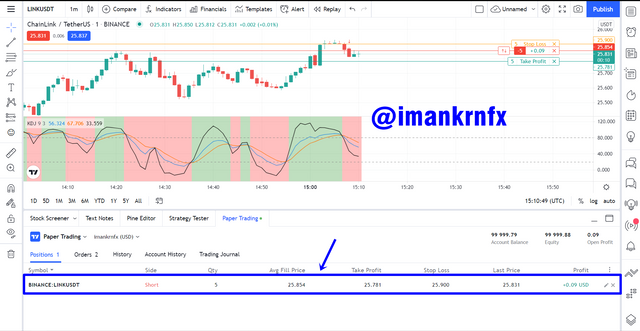
After that I made a short order with an indication that the price of the LINK coin will decline in the near future. I made a sell order with the following details:
- Quantity: 5.
- Entry Price: 25.854 USDT.
- Take Profit Price: 25.781 USDT.
- Entry Price: 25.900 USDT.
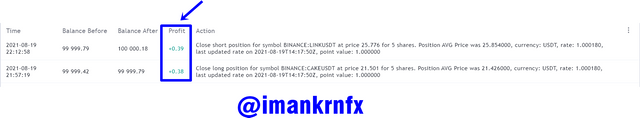
3. My Trading Results
After doing 2 types of trades in 2 different types of cryptocurrencies, I got good results which means I made a profit on both trades.
On trading the CAKE coin with a buy entry I got a profit of $0.38 and on the LINK coin trade with a sell entry I got a profit of $0.39.
Conclusion
Indicators are things that are used to support successful trading, each indicator has its own advantages and disadvantages. KDJ which is present as an indicator that can read the direction of the market trend is a very useful indicator for traders, with this indicator it will allow traders to read the direction of the trend and can even get a trend reversal signal from the market so that they can enter at the ideal price.
cc: @asaj
Superb performance @imankrnfx!
Thanks for performing the above task in the eighth week of Steemit Crypto Academy Season 3. The time and effort put into this work is appreciated. Hence, you have scored 8.5 out of 10. Here are the details:
Remarks
You have displayed a good understanding of the topic. You have completed the assigned task. Your have performed the tasks in a commendable fashion.
Thank you prof.