Crypto Academy Week 7 Season 3 Homework Post for @yousafharoonkhan [How To Create An Account On TradingView, How To Use Indicators, Tools, Features Of TradingView]
We meet again on homework for the 7th week of Steemit Crypto Academy. This time I will make a post for the homework of @yousafharoonkhan. The task this time is to answer several questions that have been given by the professor about How to create an account on TradingView, how to use indicators, tools, features of TradingView.
Definition of TradingView, Creating an Account, Types of Plans

TradingView is a platform that provides information on current market data and previous market data, This platform allows traders to get more trading information through exploration and in terms of use TradingView also helps traders to manage their income with detailed information that helps guide them all without any problems.
TradingView has become the world's first analysis platform that is completely browser based and with the latest technology, with this it will further help the expansion of the project, currently TradingView has been used by many small traders as well as large traders such as companies, all this because it offers technology and high analysis tools such as a large number of indicators and interactive interface in real time.
The TradingView platform also assists traders in determining when to buy buy trades and when to sell sell trades by proving traders with indicators that help them determine all of this.
The TradingView platform also provides several features for its users which make this platform even more user-friendly. Some of these features include: Trading feature, this feature provides a platform for users to buy and sell assets on the platform. In addition, there is another feature called the Chart feature that helps traders to find out how the trend of an asset is moving, whether it is in an up or down trend.
Alright, this time I will show you how to create a free TradingView account or free of any fees.
1. Creating a Free Account On TradingView
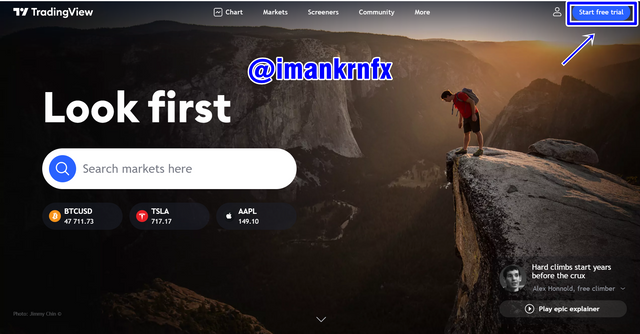
To create an account on TradingView, the first thing we have to do is log in to the official TradingView website. After we successfully enter the TradingView website, we select the option "Start free trial".
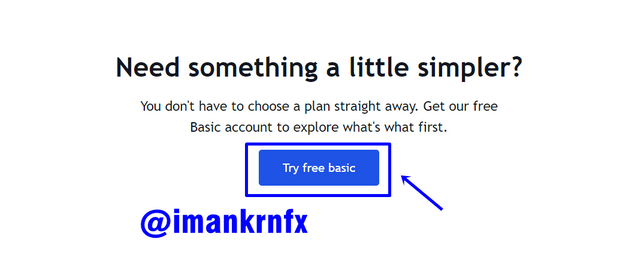
Because we are going to create a free account, we select the "Try free basic" option at the bottom of the page.
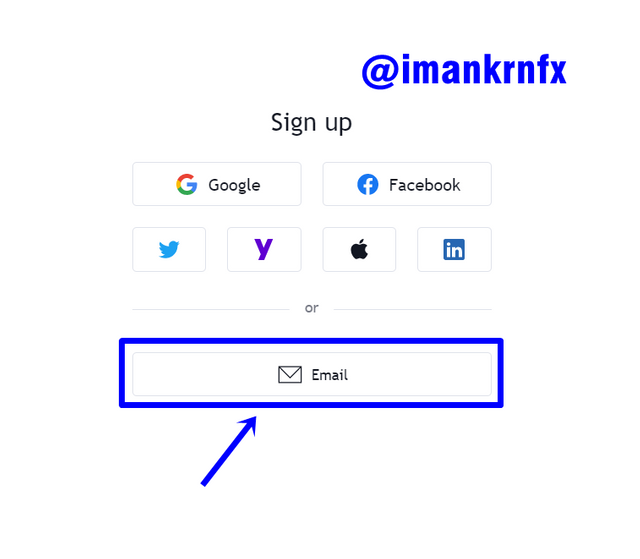
There will be several options for creating an account, such as using a Google account, Facebook, Twitter, etc. But this time we are just trying to create an account using our own personal email.
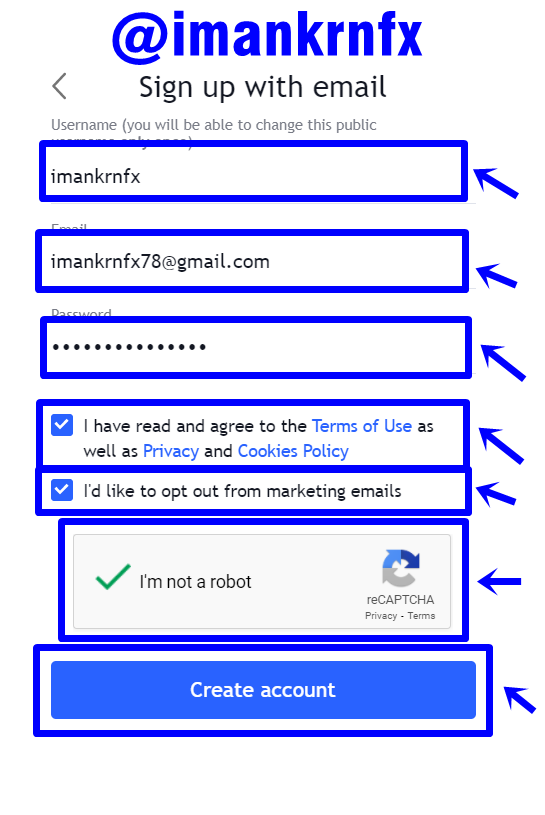
After that we will be asked to fill out a form containing username, email, and password. After everything is done, we select "Create account" at the very bottom.
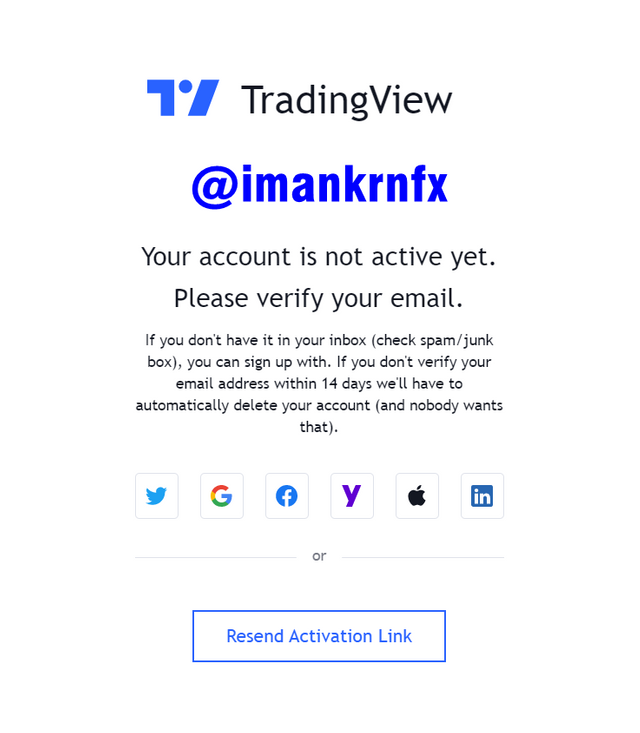
There will be a notification that TradingView has sent a verification link to the email that we registered earlier.
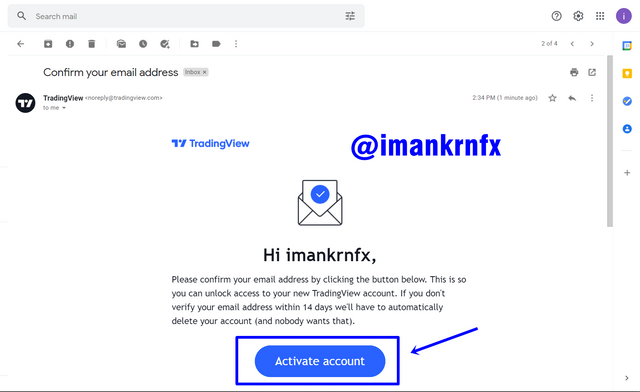
After we enter the email and open the email sent by TradingView, there will be a button that will be useful for verifying our email. We just click on the button.
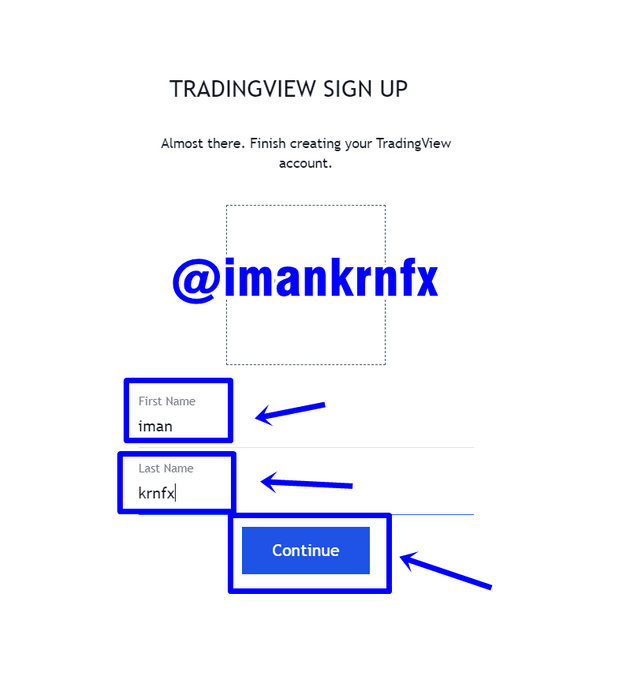
After that we will be asked to enter a photo along with our first and last name. When finished we click the "Continue" button.
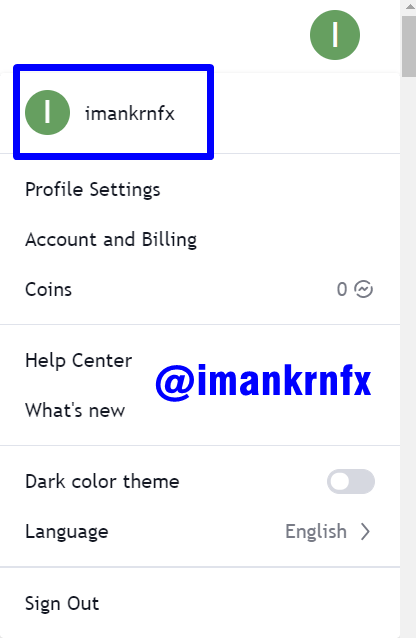
All of our account creation processes have been completed and our account has been used to carry out any activities on the TradingView website.

2. Types of plans available on TradingView
On the TradingView website there are several other options that everyone can choose from, the option I mean is creating a special account or one that has a class above the free account that we created earlier. The advantage of this account is that it has wider limitations than the free account.
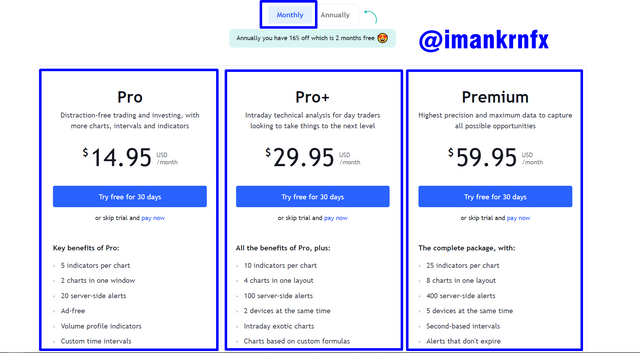
This special account is a paid account which is divided into 3 types, including: Pro Account, Pro+ Account, and Premium Account. TradingView makes 2 payment options that we can choose as we like, the choices include monthly payments, and annual payments.
Monthly Payment
The amount of fees we have to pay for monthly payments for each type of account include:
- Pro = $14.95
- Pro+ = $29.95
- Premium = $59.95
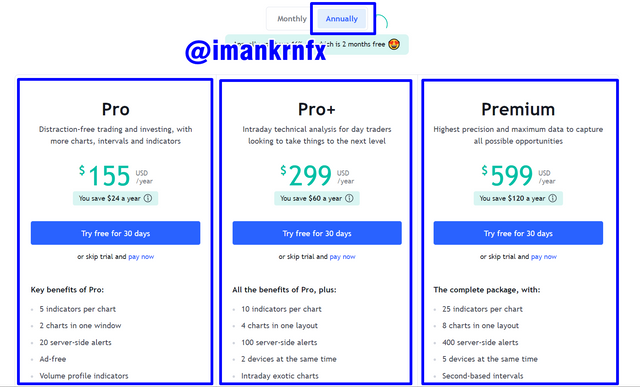
Annualy Payment
The amount of fees we have to spend for annual payments for each type of account include:
- Pro = $155
- Pro+ = $299
- Premium = $599

Features Of TradingView
TradingView is a website that is famous for its unique and complete features to help traders make trading decisions. These features include:
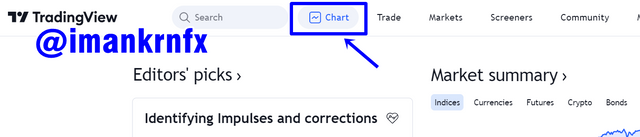
1. Charts
The first TradingView feature you should know about is charts. This feature is a feature that provides traders with information in the form of a graph of the price movement of an asset. Traders can monitor the price movements of cryptocurrencies or any asset directly and on the chart, various tools and indicators have been provided that can help traders trade.
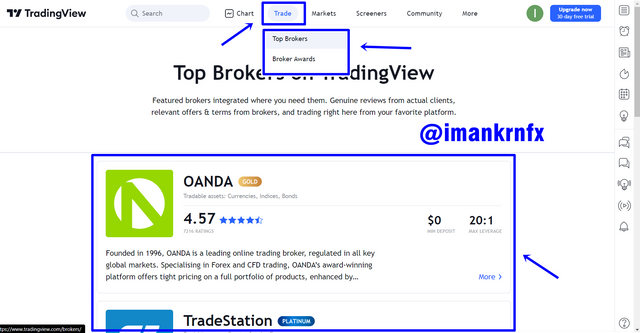
2. Trade
The next feature is Trade. In this feature we will be given a list of brokers who have good ratings so that we can trade with these brokers. All the details of these brokers have been included in this feature so we don't have to bother looking for information on other websites.
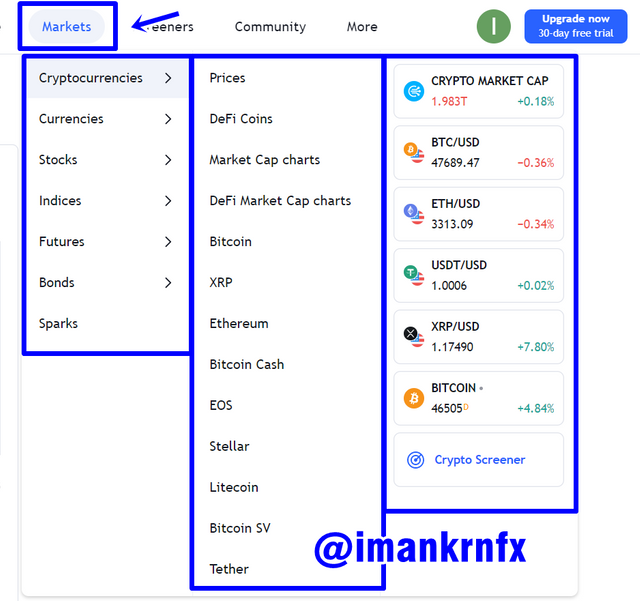
3. Market
The market feature is a feature that shows various markets that can be traded, as in the example below there are cryptocurries, stocks, futures, etc. markets that we can access on TradingView.
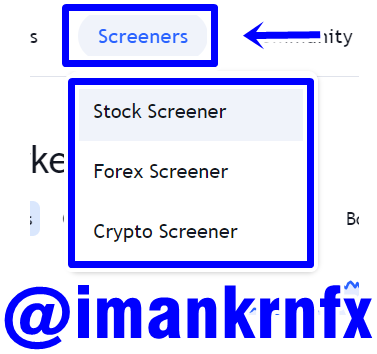
4. Screeners
This feature is a useful feature for filtering assets according to the criteria we want, so assets that do not meet the criteria will be filtered and will not be shown on the list.
Favorite Features
I really like the first feature I mentioned earlier, the Chart. In my opinion, this feature is the main and most important feature of TradingView, because almost all traders who visit TradingView want to directly monitor market movements, and it is this chart feature that can fulfill the wishes of these traders.
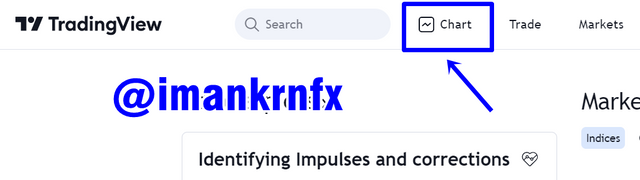
Setting Up a Chart In TradingView and Use Two Tools
There are several things we can set on the chart in TradingView. The trick is that we go first on the Chart menu.
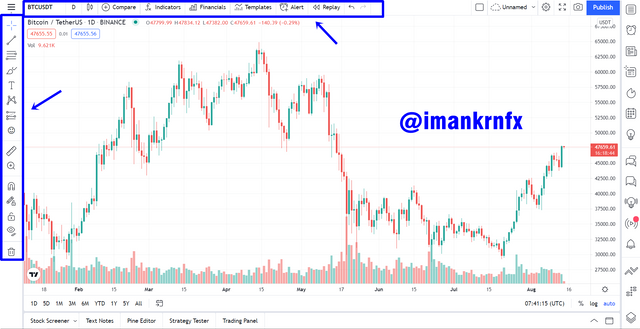
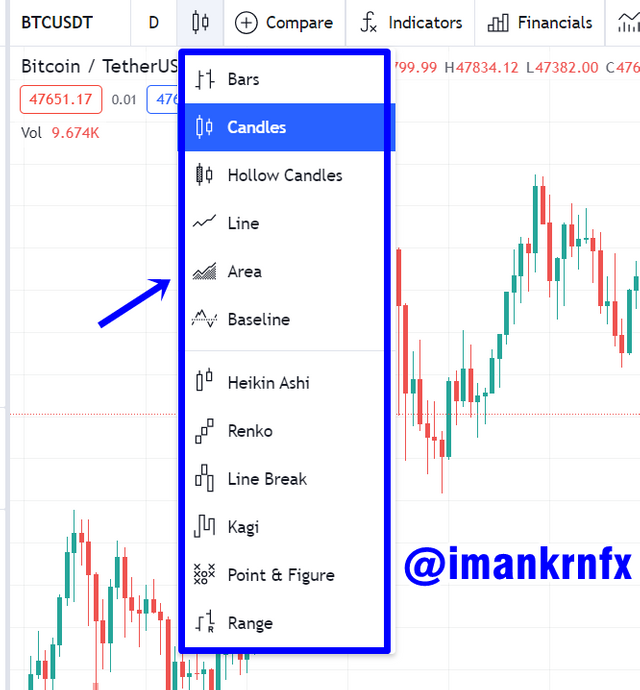
After the graph has appeared we can immediately set the graph according to our wishes. For example, if we want to change the type of chart that is on the chart, we can choose the types of charts that have been provided, you can see the details in the picture below.
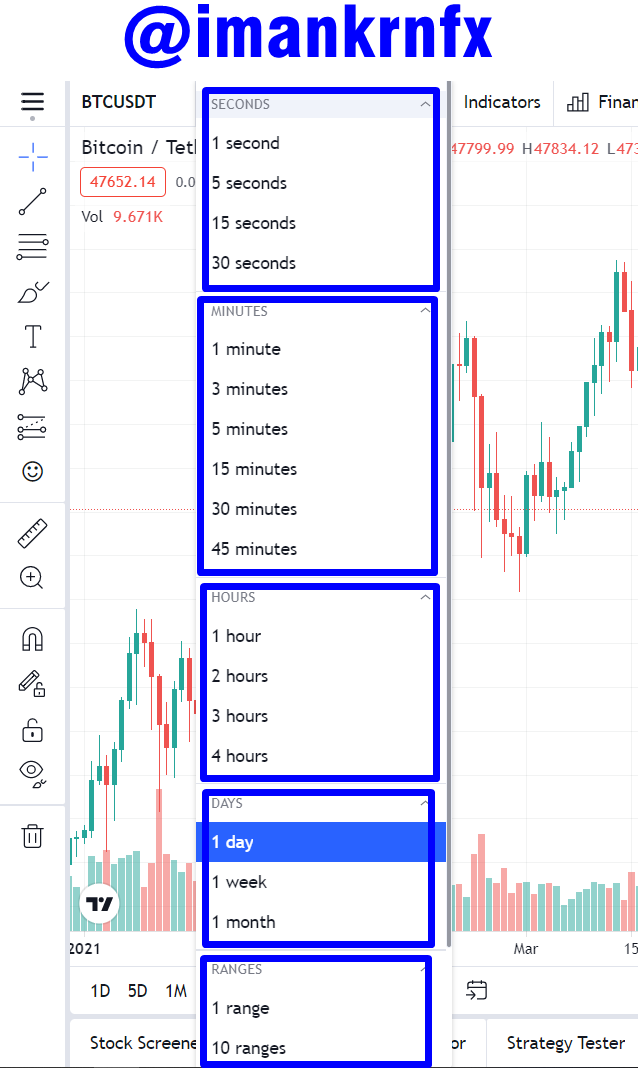
Then we can set the timeframe shown by the graph according to our wishes. We can set it based on a certain time range, days, hours, minutes, or even seconds.
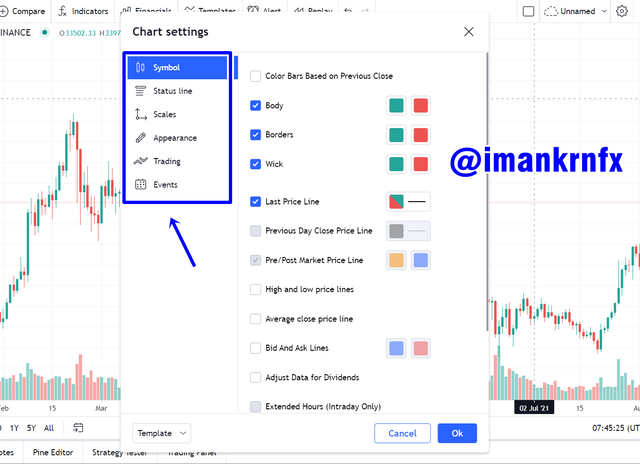
After that, we can change the color of the candles shown on the chart, and of course we can change the scale of the chart according to our individual needs.
Using 2 tools on TradingView
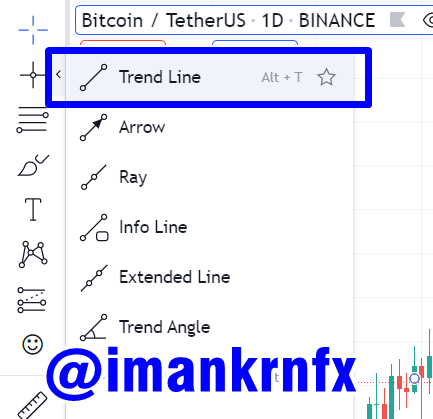
1. Trend Line
The first tool I will discuss is Trendline, trendline is a feature that allows traders to draw a line directly on the chart. Usually traders use this to draw support and resistance lines. To use this tool, we just need to select it in the tool set on the left of the graph.
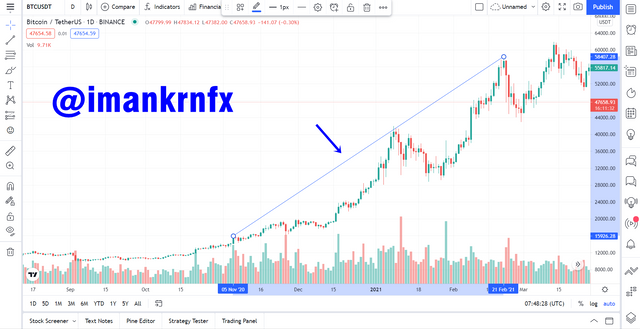
After that we just draw the line directly on the graph, for example in the image below.
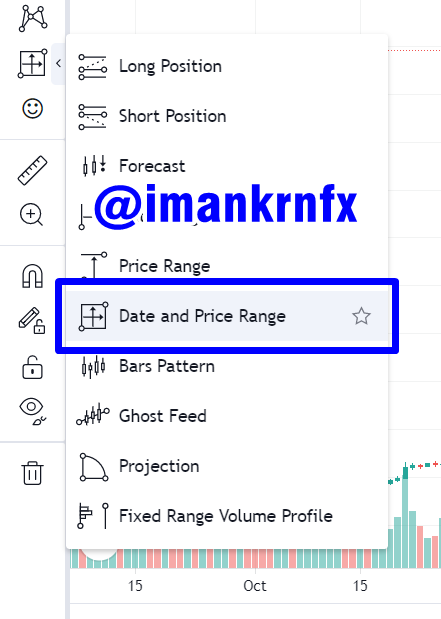
2. Date and Price Range
This tool will help traders to see how much increase and decrease that occurs in a cryptocurrency within a certain period of time. To use this tool, we just need to select it in the tool set on the left of the graph.
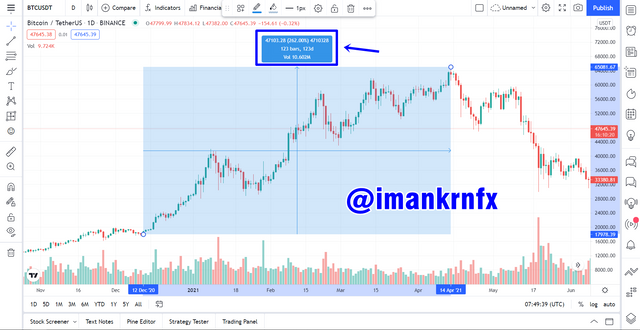
After that we just draw the line directly on the chart, and there will be information that appears in the form of the percentage change in price and time range. An example can be seen in the image below.
Adding Indicator in a Chart
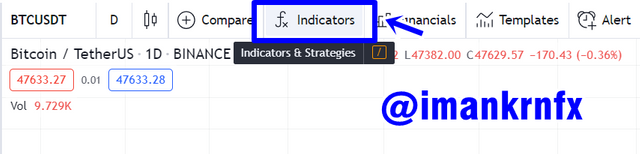
We can use an indicator that we can use to help us in trading. The first step is that we first select the "Indicators" option at the top.
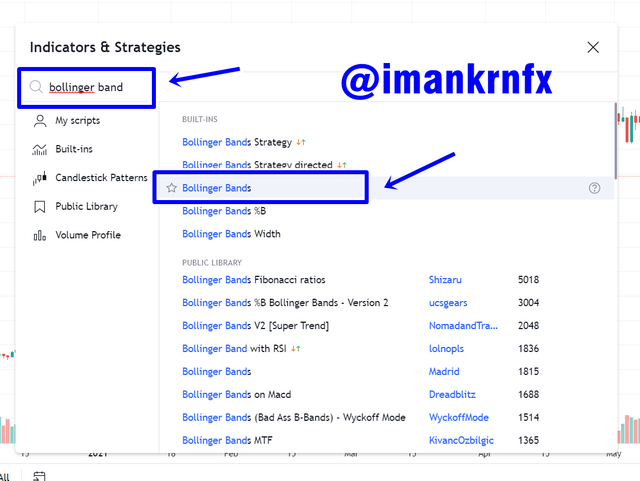
After that, we will use the indicator that we want in the search column, here I am an example of putting the indicator "Bollinger Bands".
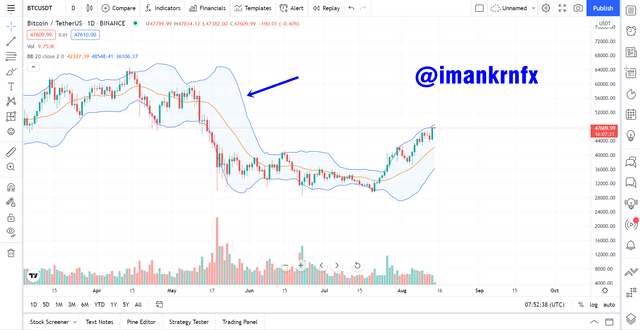
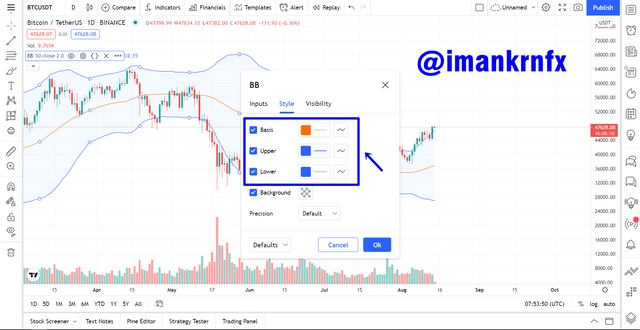
If we have selected the indicator, it will appear directly on the chart. You can see in the picture below the Bollinger Bands indicator that I chose earlier has appeared on the chart.
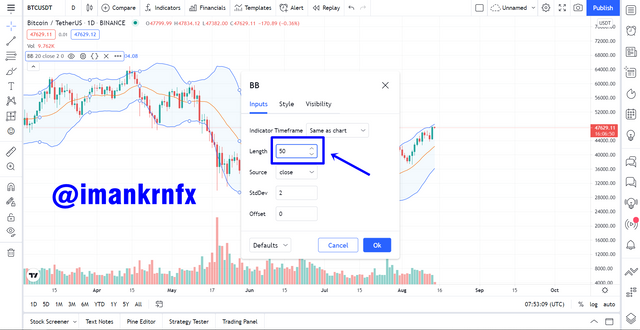
We can easily change the settings of the indicator through the settings section, things we can change include the length, color of each line, etc.
Reasons for Choosing Bollinger Bands
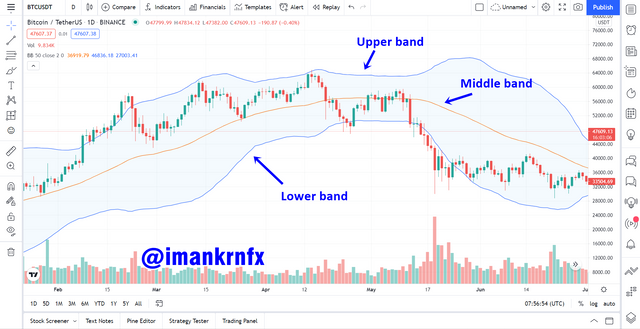
In my opinion there are almost no traders who are not familiar with this indicator, Bollinger Bands is a very well-known indicator and has been used by many people to trade. What made me choose Bollinger Bands is because this indicator can help us to measure market volatility and estimate the range of price movements in cryptocurrencies. This indicator consists of three lines that follow the price movement, including: Upper band, Middle band, Lower band.
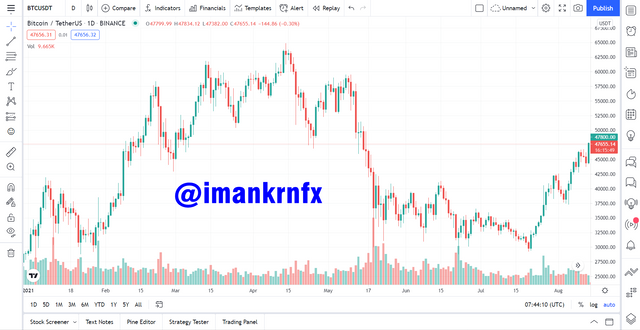
By relying on this indicator we can know when we can start entering to buy a cryptocurrency and when we should sell it. We can take this decision if the candlestick on the chart touches one of the Bollinge Bands lines on the outside. If the candle touches the Lower band then it is a good time to make a purchase, while if the candle touches the Upper band then it is time for us to sell our assets.
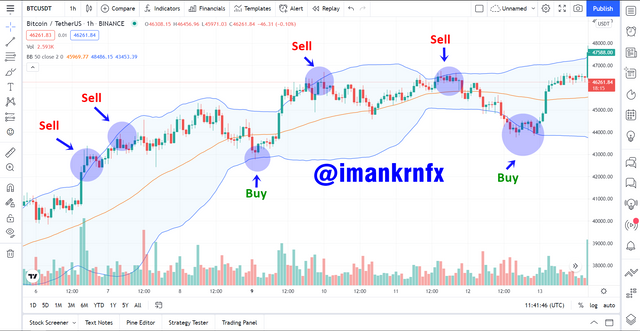
For example, we can see in the BTC/USDT chart above, every candle stick touches the Upper band then the price of BTC will decrease, and vice versa if the Candlestick touches the Lower band then the price of BTC will increase.
My Opinion About TradingView For Cryptocurrency
TradingView is a multi-purpose website that is very useful for monitoring cryptocurrencies and those that operate well, this website also has a set of indicators and charts of many different pairs in one place providing this very nice unique feature makes me see TradingView is very useful for our trading activities.
TradingView allows users to trade safely and create charts with people who have experience in trading, the website also offers expert advice when it comes to predicting upcoming trends and asset prices why it also provides advice on when to enter a trade and when to get out.
In addition, TradingView provides comprehensive charts of the state of the market in real time with no delay at all. And don't forget that it has a variety of technical indicators ranging from the simplest for beginners to use, to the most advanced ones for experts to use.
So in my opinion, with everything that TradingView has to offer it makes it very useful for traders in trading cryptocurrencies. Whether it's a beginner trader or a professional trader.
Conclusion
After doing this homework, I finally realized that TradingView has helped many investors to predict trends for various assets such as cryptocurrencies, stocks, gold, etc. With the help of tools and indicators such as Bollinger Bands, EMA, etc. it will be very helpful for traders to reduce the level of losses.
TradingView is a platform that is phenomenal in this modern world with the huge growth of cryptocurrencies, TradingView has helped us as traders to know the wide world of trading and operations and this platform makes me personally very happy because I can easily trade easily without having to be afraid of making mistakes in making decisions.
Respected first thank you very much for taking interest in SteemitCryptoAcademy
Season 3 | intermediate course class week 7
there are many feature , but you explored just four feature, over all
thank you very much for joining this class
Thank you for the remark professor.