Crypto Academy Week 5 Season 3 Homework Post for @imagen [Market Patterns and Blockchain Projects]
We meet again on homework for the 5th week of Steemit Crypto Academy. This time I will make a post for the homework of @imagen. The task this time is to answer several questions that have been given by the professor about Market Patterns and Blockchain Projects.
Invest in Student Coin as much as $12
In this first question, professor @imagen asked us to invest in a coin or token, so I chose a very new token called Student Coin. Because Student Coin (STC) is a new token, it has not yet been listed on various exchanges, therefore I will show you how to buy STC tokens that have been listed on an exchange, namely Bittrex.
1. Purchasing STC Tokens

source
The first step we have to do is to first log in to our Bittrex account. Then after the login process is complete, we scroll down on the Bittrex home page until we reach the "Market" menu. After that, we search for the STC token in the search field on the right of the page, it will show several STC token markets, including STC/BTC and STC/USDT. Because I have USDT so I choose the STC/USDST market.

After that we will be taken to the STC/USDT market page which looks like the picture below, then on the right there is a tool where we can buy STC tokens.

For this example, I will make a purchase at the market price, because I want my purchase order to be executed immediately. After that I enter the amount of USDT I want to sell to buy STC and finally I just click the green button at the bottom.

Then we will confirm the purchase so that the order we make can be attached to the order list.

After that, a pop-up will appear informing you that our purchase order installation process has been successfully installed. Then above the pop-up, another pop-up appears informing us that our purchase order has been successfully executed.

Then we go to the "Holding" menu where all the cryptocurrencies we have are shown, as you can see my purchase of STC tokens has been successful and the STC tokens are already in my Holding menu.

As complementary evidence, you can see in the picture below which is the order history of the purchase of STC tokens that I have done before.


2. Reasons for Choosing STC Token
As I said earlier, STC is a new project and has just launched in 2021. After I read various information, I found several things that made me choose Student Coin as an example of where I invest at this time, among others:
First Token In Education
From the name itself we can already conclude that this project is shown to the world of education. One of the goals of making STC is as a place of access for students to learn about blockchain and cryptocurrencies.As a Voting Platform
Every user of the STC can exercise their right to vote in the election of the place they study such as a university. Student Coin has a technology that allows the voting procedure to be carried out without requiring personal data to be filled in first and the voting process will be very fast because it uses a blockchain performance system.Have Own Exchange
This is a feature that has not been created by Student Coin. However, this is a feature that will be realized in the future. This feature allows students who have STC tokens to make purchases of any cryptocurrency they want, thereby reducing unnecessary fees.

3. Current Price, Market Capitalization, Market Rank and Circulating Supply of STC Token

source
According to the CoinMarketCap website, the current price of Student Coin is $0.007676 which is experiencing an 8.72% increase in price in the last 24 hours. Currently Student Coin is ranked 473 out of 11,120 cryptocurrencies which is a good thing if we see that Student Coin is a very new project.
Then the Market Capitalization of this token at the time this task was created was $40,862,478 with a total supply of 5.32B STC tokens that have been circulating which is 53% of the total existing STC tokens of 10B STC.

4. Founder, Project Goal and Roadmap of Student Coin

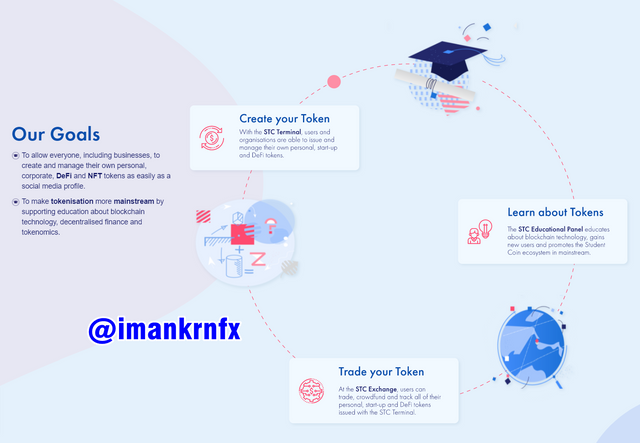
Student Coin is a project created by Wojciech which is a token that uses a blockchain system that entered the world of education for the first time. This token is designed on all the world's best universities,
Student Coin also aims to show the future of the world's digital economy. Student Coin is a platform that provides users with features to easily design, create and manage their own tokens. Currently, the Student Coin project is held by Wojciech and his colleagues, including:
- Andrew as Chairman of the Advisory Board.
- Daniel as Student Coin CMO.
- Hugo as Student Coin CTO.
- Caesar as Student Coin COO.
- Greg as Tech Lead.
- Peter as Student Coin Vice President.
- Jacob as Student Coin CRO.

The purpose of the Student Coin is to provide a place where individuals and companies manage the tokens they create. They can create integrated DeFi directly on Student Coin and even everyone can create their own NFT token easily.
The target people targeted by Student Coin are students who are still in the learning stage of blockchain and cryptocurrency. The existence of Student Coin will make the learning process of these students more optimal and able to make blockchain adaptable to the educational environment.

This project was first created at the end of 2017, in that year the team came up with an ecosystem idea that Student Coin would use. Then in 2020 Student Coin started doing some pretty big things such as launching a DEX and this year they started distributing it to various universities in the world.
Then in early 2021, Student Coin began conducting ICOs which were held on their official website, and at this time STC has started listing on various exchanges such as Bittrex and Kucoin. In the future, they will launch their own exchange as well as launch the STC App. And this project will continue until after 2022.

Evening Star Pattern

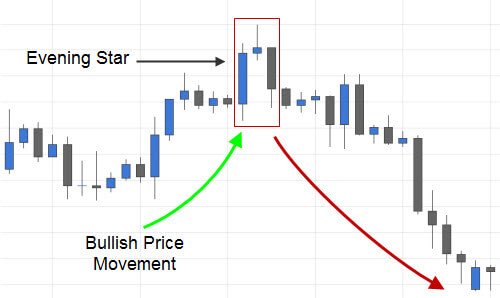
The Evening Star pattern is a signal that indicates that the trend will experience a reversal from the Bullish phase to the Bearish phase. This pattern is the opposite of his brother which is the Moring Star Pattern. If traders see a pattern like the one in the picture above, this can be used as a benchmark to start selling their cryptocurrency because it has started to decline in price. However, before deciding to sell your cryptocurrency, we must first identify several things, such as:
The candlestick on the chart is already showing a long Bullish phase.
At the end of the bullish phase or on the first day of the Evening Star pattern there will be a green candlestick that has a longer body than its shadow.
The next day a candlestick will be created that has a very small body and has a shadow at the top of the long candlestick.
On the third day the cadlestick will be formed in red with a long candlestick body the same as on the first day but this time it will show that the cryptocurrency will enter a Bearish phase.
After the red candlestick is formed, the phase will reverse from the Bullish phase to the Bearish phase.
If you see all these things, it would be highly recommended to immediately sell the cryptocurrency that you hold to get a profit while avoiding losses from the ongoing Bearish phase. Evening Star is a pattern that is very suitable to be followed because of its very high level of accuracy, which is above 50%. Even according to Thomas Bulkowski explained that the Hit-Rate of the Evening Star pattern reaches 72%.

Abandoned Baby Pattern
The Abandoned Baby pattern is a reversal pattern that signals that the phase will experience a reversal. There are two types of Abandoned Baby patterns available, namely the Bullish Abandoned Baby and the Bearish Abandoned Baby.
1. Bullish Abandoned Baby

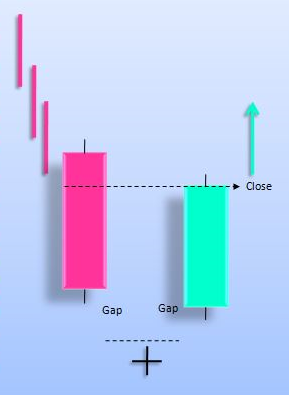
Bullish Abandoned Baby is a pattern that identifies that a chart will change from a Bearish phase to a Bullish phase. To ensure this pattern, there are 3 things that we will identify first, including:
The chart will show a bearish candle with a long body with a small shadow.
After that there will be a candle that has a short body or even no body at all and this candle has a gap or distance from the closing price of the previous candle. This candlestick is called the Doji Candle.
After that a bullish candle will appear with a body length of at least 50% of the previous Bearish candle body. The opening price of this candlestick also has a distance or space compared to the closing price of the previous candlestick.

2. Bearish Abandoned Baby

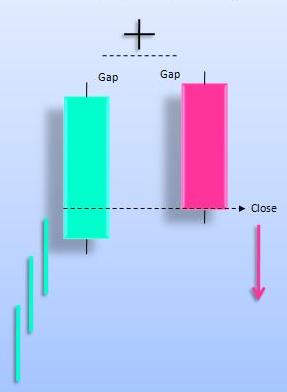
Bearish Abandoned Baby is the opposite pattern of Bullish Abandoned Baby, this pattern identifies that a chart will change from a Bullish phase to a Bearish phase. To ensure this pattern, there are also 3 things that we will identify first, including:
The chart will show a Bullish candle with a long body and a small shadow.
After that there will be a candle that has a short body or even no body at all and this candle has a gap or distance from the closing price of the previous candle. This candlestick is called the Doji Candle.
After that a Bearish candle with a long body will appear. The opening price of this candlestick also has a distance or space compared to the closing price of the previous candlestick.

3. Correctness Percentage of Abandoned Baby Pattern
The Abandoned Baby pattern is a pattern that is very rarely found, because the doji candle only occurs if indeed on that day there is a strong resistance to market demand from both parties so as to make market demand balanced and make the candle have a very small body. The accuracy of these two patterns is in the range of 60% to 70%.

BTC Chart Analysis for 3 and 7 Days
1. BTC Chart Analysis for 3 Days

On the BTC chart above for the last 3 days I used a 1 hour timeframe. And on the graph we can see that there are 2 types of patterns created, including:
Evening Star Pattern
At the beginning of the chart we can see that the trend is showing a bullish phase. However, the last Bullish candle shows the Candle has a small body accompanied by a long shadow. After that the Bearish candle has started to appear with a body that is almost as large as the previous bullish candle. This marks the end of the Bullish phase and replaced with the Bearish phase.Three White Soldier Pattern
There are 2 times showing the Three White Soldier pattern. At both times we can see there are 3 Bullish candlesticks that have a very large body and point up. This will strengthen our analysis that the trend at both times is experiencing a Bullish phase.

2. BTC Chart Analysis for 7 Days

Unlike the BTC chart for 3 days, in the BTC chart analysis for the last 7 days I used a 4 hour timeframe. And on the graph we can see that there is only 1 type of pattern created, namely:
- Three White Soldier Pattern
Same as the previous chart. The chart above shows that there were two times where there were 3 bullish candlesticks that had a very large body and pointed upwards. This will strengthen our analysis that the trend at both times is experiencing a bullish phase.

Conclusion
Analysis in choosing cryptocurrencies to invest must be very careful, we should not choose a cryptocurrency if we do not do deep fundamental analysis such as analyzing Market Capitalization, Roadmap, Project Team, etc. All of these things must be analyzed first before making a decision to invest.
Likewise in trading, we must pay attention to the various candlestick patterns created on the chart, because these patterns will give us a signal that whether the trend of a cryptocurrency is experiencing a decline or even experiencing a reversal.
cc: @imagen
Gracias por participar en la Tercera Temporada de la Steemit Crypto Academy.
Felicitaciones, realizastes un gran trabajo.
Continua esforzandote y espero seguir corrigiendo tus asignaciones.
Thank you so much.