Crypto Academy Week 3 Season 3 Homework Post for @imagen [Introduction to Technical Analysis of Price Patterns]
We meet again on homework for the 3rd week of Steemit Crypto Academy. This time I will make a post for the homework of @imagen. The task this time is to answer several questions that have been given by the professor about Technical Analysis of Price Patterns.
Staking on Sun.io

This time I will give an example of staking on one of the platforms on the Tron Blockchain network, namely Sun.io. This platform is one of the platforms that offers staking token sun which will offer a number of profits for people who stake on this platform.
I took Sun.io because this platform is in the Tron Blockchain network where we as steemians already have a Wallet from Tron as a place to receive TRX rewards from each of our posts, so we will easily process staking on the Sun.io platform. I will practice through an application on a smartphone, namely TronLink Wallet Pro.
Before we're staking, we will connect our wallet with sun.io first, the method is very easy.
1. Connecting TronLink Wallet to Sun.io
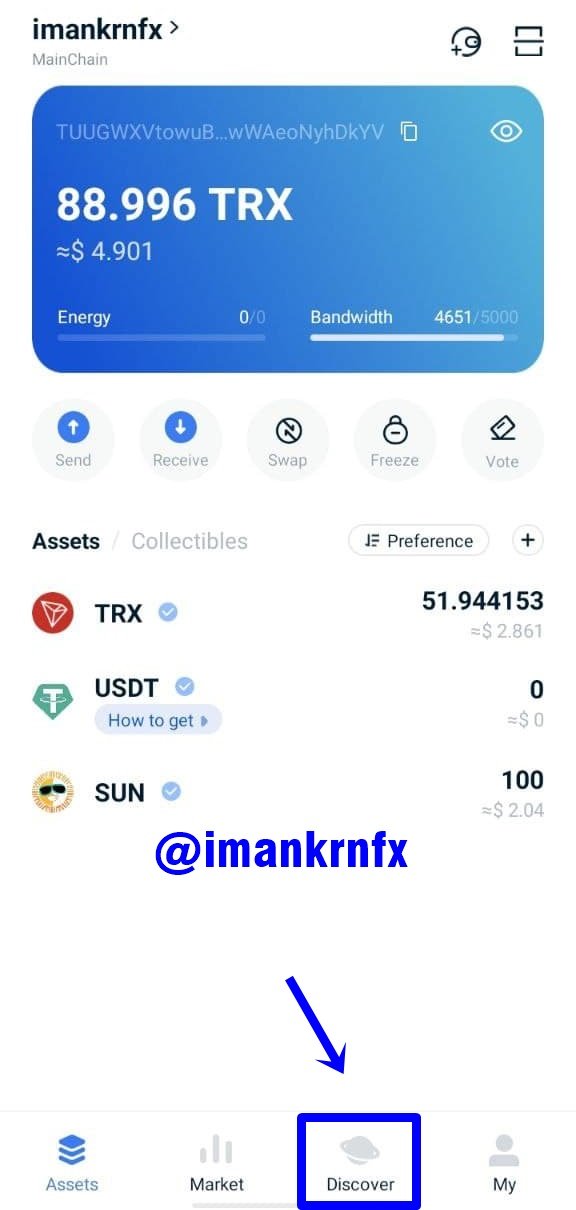
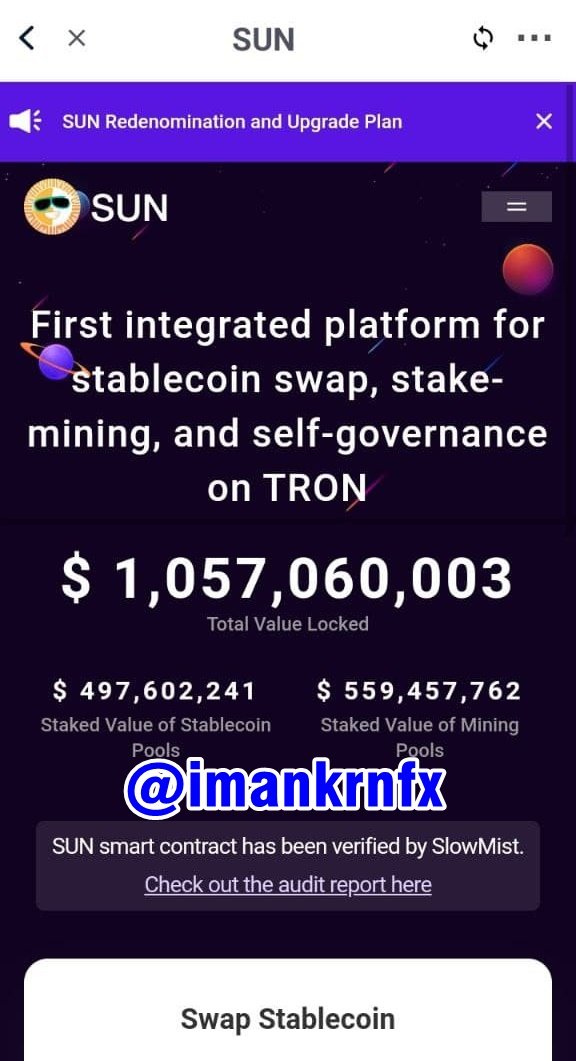
First of all, we first open the TronLink Wallet Pro application and on the start page we select Discover which is at the bottom of the screen.
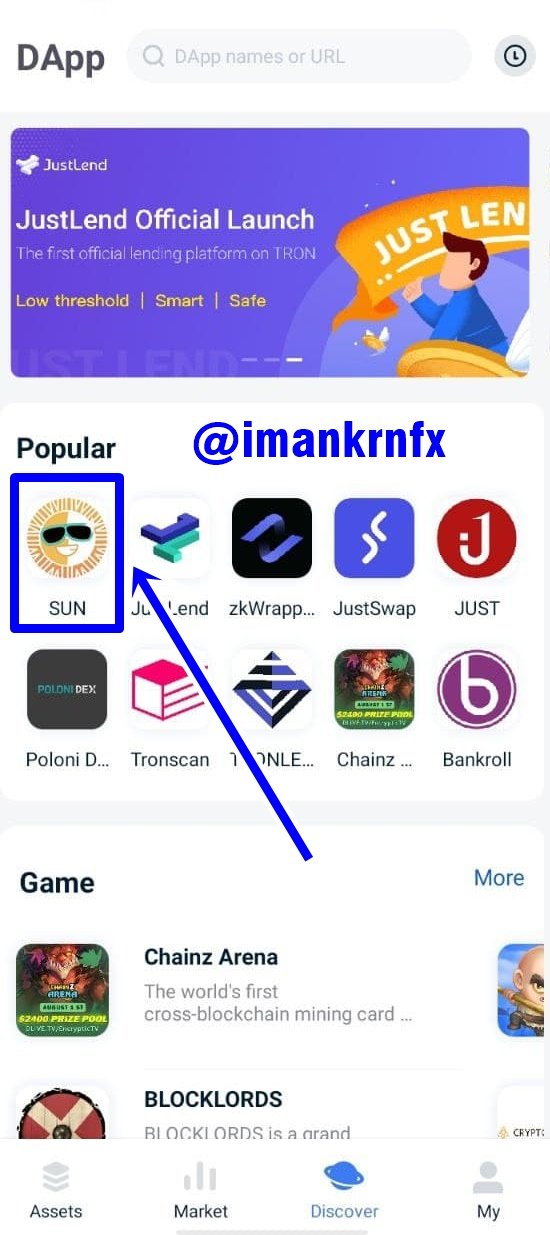
After that we select the SUN icon in the middle of the Discover page.
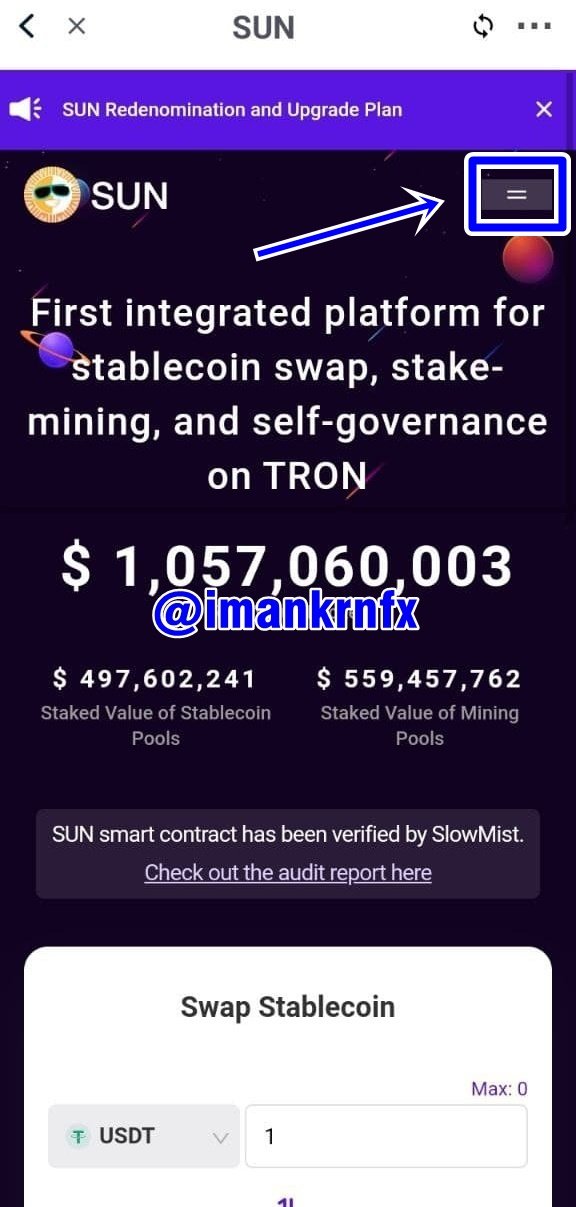
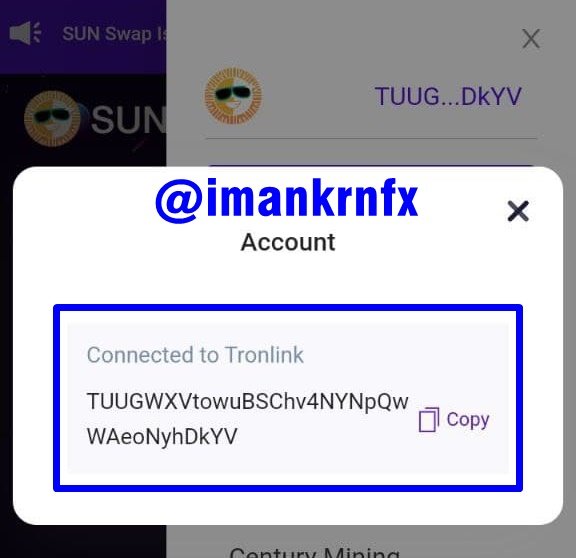
Actually, by doing this process we have successfully connected our wallet, to check it we just select the two line icon at the top of the page.
Then select the SUN icon at the top.
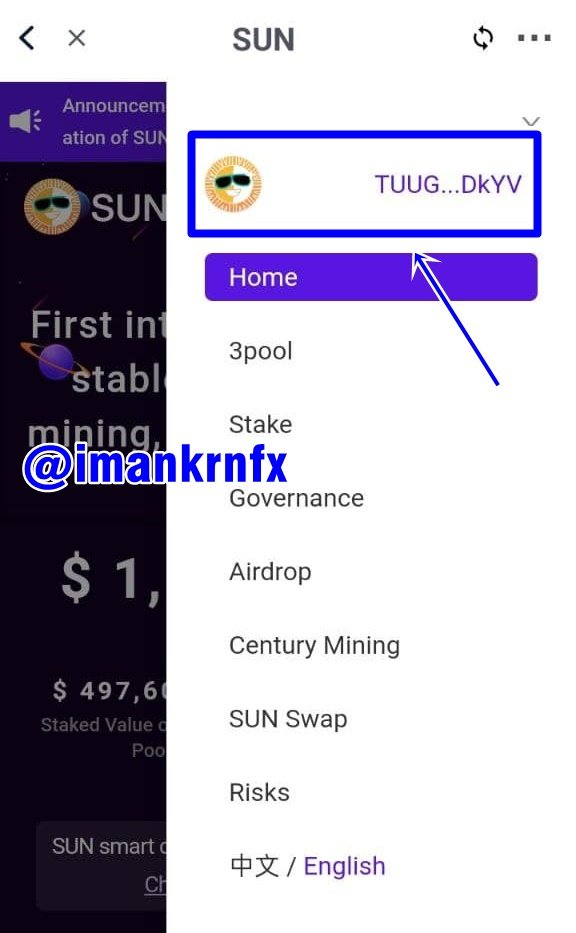
And we will be shown that our wallet is already connected to Sun.io.
2. Staking on Sun.io
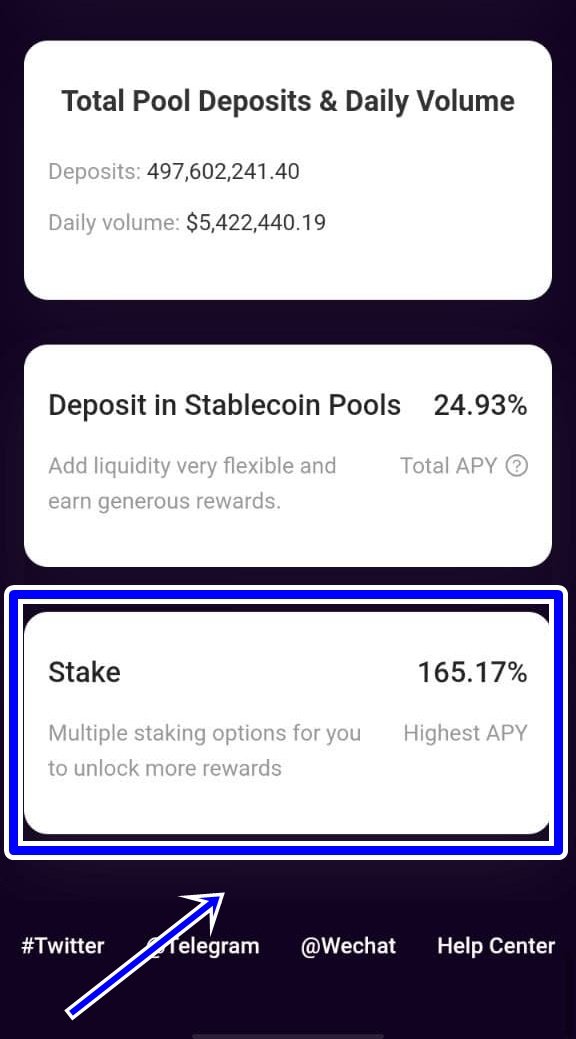
To stake on Sun.io we have to go back to the home page of Sun.io first.
Then we scroll down until there is a Stake option menu at the bottom.
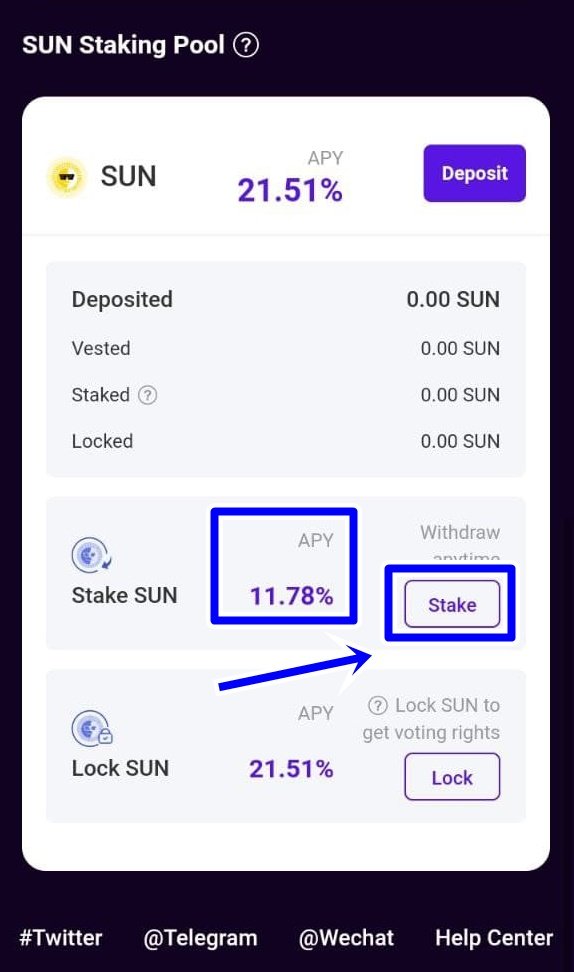
Then we will be taken to the staking page. Because I want to stake SUN tokens, then I choose the option to stake SUN tokens, the options are at the bottom, so we just have to scroll down.
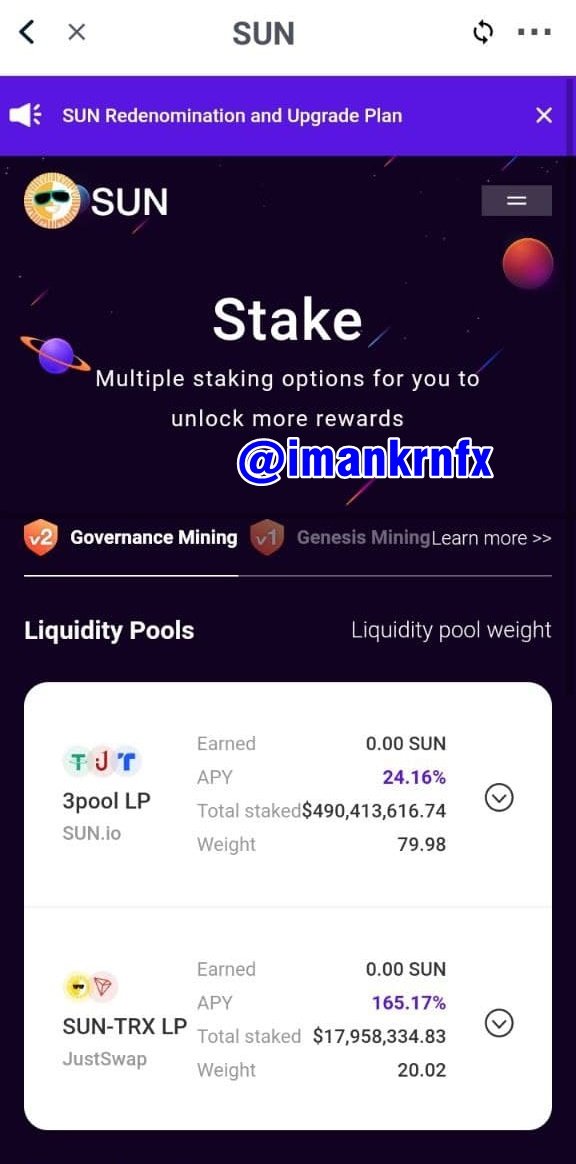
Then we can see if we stake SUN then we will get APY of 11.78%. To stake, we just select the Stake option.
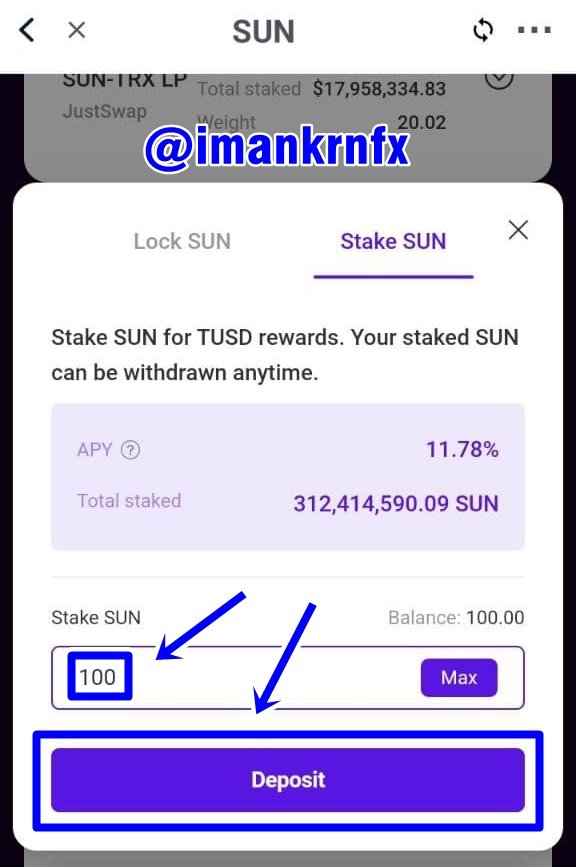
Then here we will enter the number of SUN tokens that we will stake, here I will enter 100 SUN.
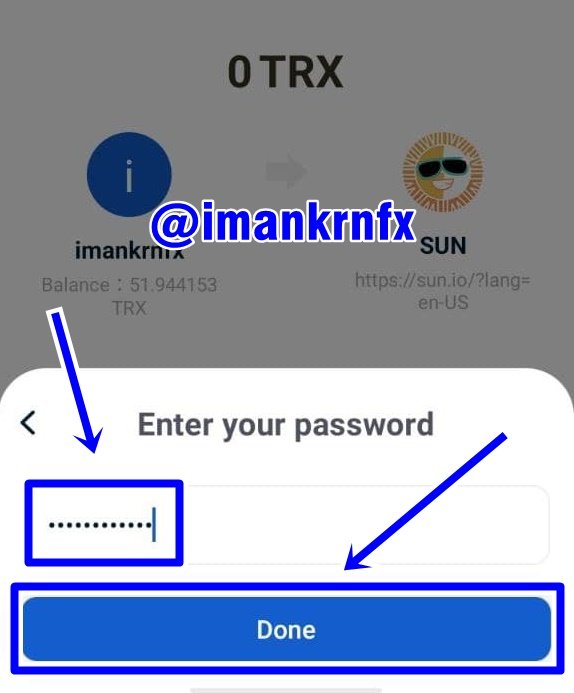
Then we will enter the Password to confirm staking.
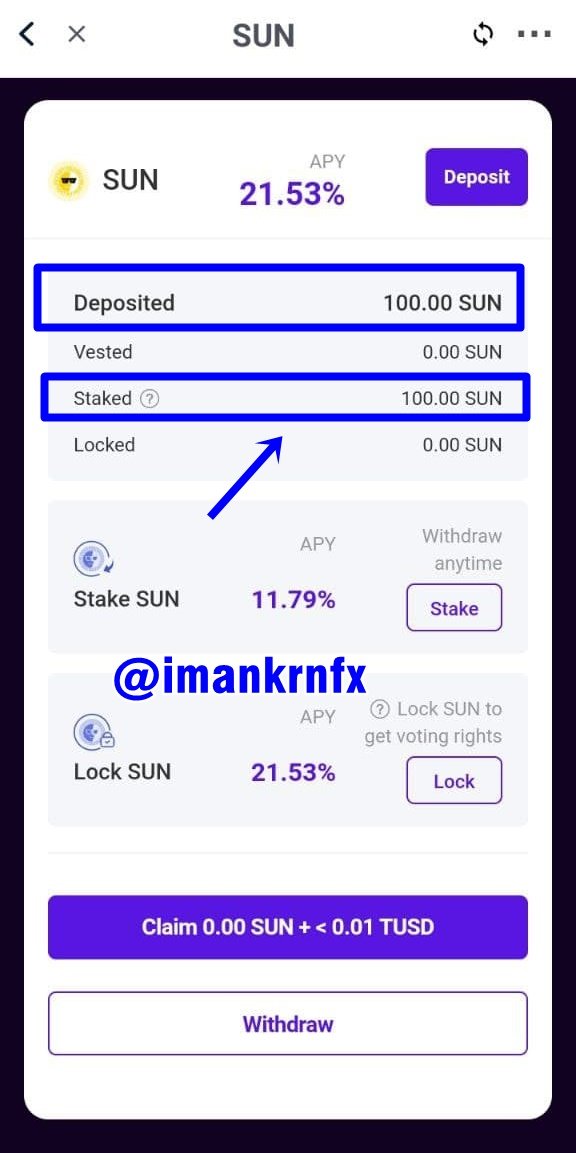
After that, if we return to the previous page it will be shown the details of the stake that we have done. The picture below shows that I have staked 100 SUN tokens, which means that my staking process was successful.
3. Estimated Staking Revenue for 1 Year
By staking SUN on Sun.io we will be given a benefit of adding SUN tokens with an APY of 11.78% (assumed not to change for 1 year) and I stake my SUN tokens as much as 100 SUN for 1 year.
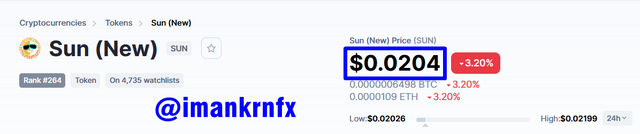
If we look at the current SUN price on Coinmarketcap which is $0.0204, and we will assume that the price of SUN will not change during this one year.
With all this data, I can calculate how much money I will get by stake on Sun.io, the details include:
Number of SUN tokens I will get in 1 year:
- 100 SUN x 11.78% = 11.78 SUN
Total amount of USD I will earn in 1 year:
- 11.78 SUN x $0.0204 = $0.24
From these calculations, we can conclude that by staking 100 SUN on Sun.io for 1 year, I will get $0.24.
Perform a 7-day and 30-day Technical Analysis on 3 Cryptocurrecies
Now I will show you how to analyze a graph of cryptocurrency. There are cryptocurrencies that I took as an example this time, namely Theta, VeChain, Solana using 2 different timeframes which are 1 hour to analyze for 7 days and 4 hours to analyze 30 days.
1. Theta
(7 day analysis)
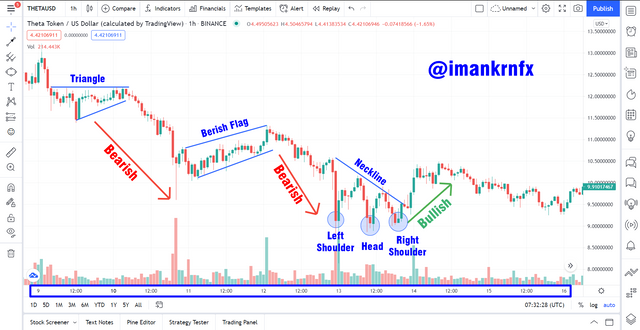
In the Theta chart above, we can see that there are three types of patterns that occur on the chart, namely the Triangle pattern, Bearish Flag, and Head and Shoulders.
In the triangle pattern, it shows that there is an increase in support while the price of resistance tends to be stable before entering the Bearish phase. Then there is the next pattern that is formed, namely the Bearish Flag, in this pattern the support and resistance lines are both increasing, indicating that a Bearish trend will occur again in the near future. And finally, there is a Head and Shoulders pattern which also ends the Bearish trend towards the Bullish trend.
(30 day analysis)
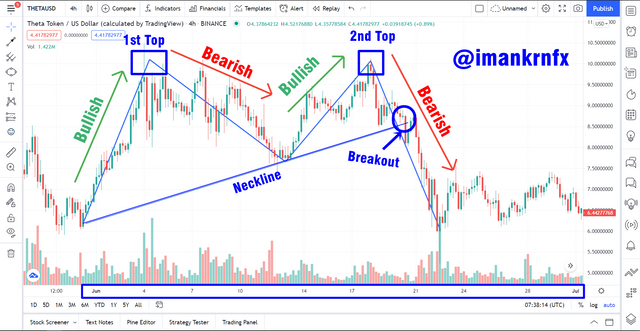
In the analysis for 30 days, we can see in the chart above there is one very large pattern, namely the Double Top.
On June 4, the price of Theta experienced a significant increase, but not long after it decreased until June 13, after that the price of Theta increased until June 18 and after that it experienced a decline again until it crossed the neckline line which indicated the trend had entered a phase. Bearish.
2. Vechain
(7 day analysis)
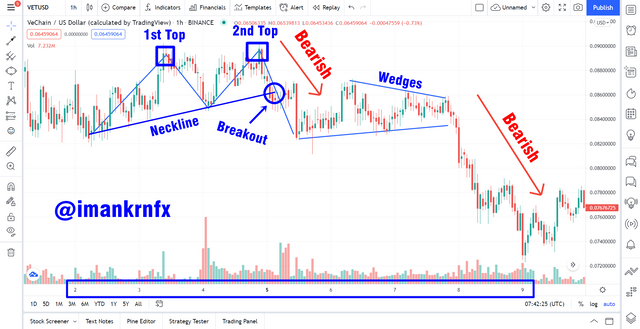
In the Vechain chart above, we can see that there are two types of patterns that occur on the chart, namely the Double Top and Wedges patterns.
At first the VET chart increased for 1 day, then 1 then it experienced a decline in the previous price after which it increased again until finally it broke the neckline line which indicated it was entering a Bearish trend. Then after that there was a Wedges pattern where the support and resistance lines were both converging until they finally experienced a deep Bearish trend.
(30 day analysis)
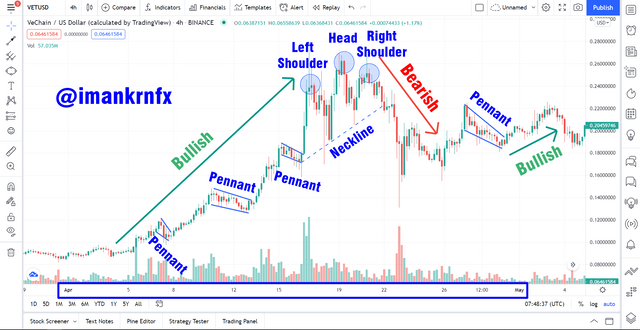
In the 30-day analysis, we can see in the chart above that there are 2 different types of patterns, namely Pennant and Head and Shoulders.
The Pennant pattern occurs several times when the VET coin trend is entering a major Bullish trend. In that phase, there were 3 small Penants which proved that Treand was currently Bullish. Then after the Pennant patterns ended there was a Head and Shoulders pattern where there was a selling resistance in the market so that after the VET price had passed the Neckline, it entered a Bearish trend. However, after the Bearish trend, the market shows that a Bullish trend will occur again by forming a Pennant pattern again which makes the trend turn back to Bullish.
3. Solana
(7 day analysis)
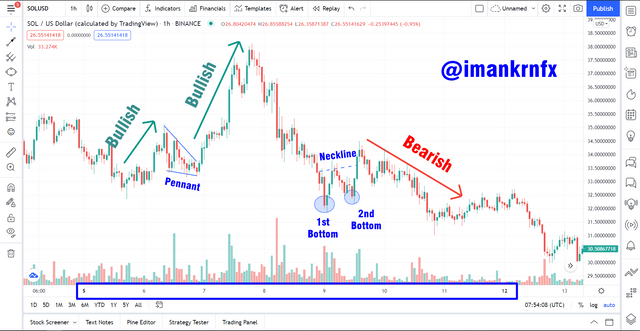
In the Solana chart above, we can see that there are two types of patterns that occur on the chart, namely continuation and reversal patterns. In the continuation pattern that occurred on the 6th, we can see that Solana's chart is forming a Pennant pattern which occurs when the trend is bullish. Then one more thing, we can see that there was a Double Bottom pattern that occurred around the 9th and 10th, because of this pattern, Solana's price had increased for a while before falling again.
(30 day analysis)
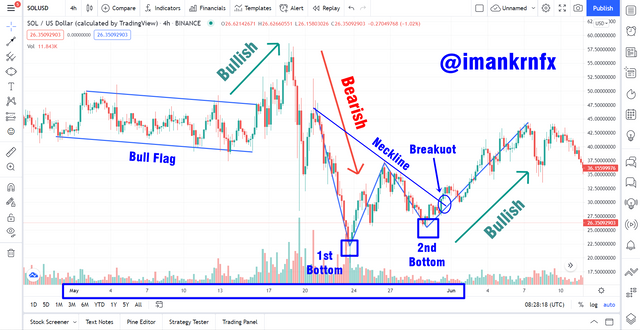
In the 30-day analysis, we can see in the chart above that there are 2 different patterns, namely the Bull Flag and the Double Bottom.
In the Bull Flag pattern we can see the graph tends to point downwards before finally experiencing a significant increase, this Flag pattern indicates that the graph will experience a Bullish phase. Then after that there was a Double Bottom pattern that formed the letter "W", we can see after the previous trend was Bearish then there was no resistance that formed a Double Bottom pattern then the trend reversed to Bullish.
Differentiate a Bullish Season From a Bearish Season
To distinguish a season on cryptocurrency is very easy because we are already very easy to access candlestick charts on any platform. By analyzing this graph, we will know whether a cryptocurrency is currently experiencing a Bullish or Bearish season.
More simply is we live the highest or lowest price of each closing price of a cryptocurrency. If we see the highest price of a cryptocurrency at every closing price in a period it always increases then we are in a Bullish season. Conversely, if we see the lowest price of a cryptocurrency at every closing price in a period, it always decreases, then we are in a Bearish season.
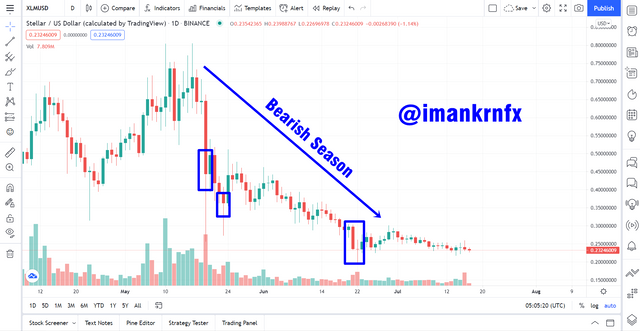
For example, you can see in the chart below, I took the example of the chart of the XLM coin with a 1-day timeframe. We can see that every highest price of XLM at its closing price has increased in recent times, this indicates that at that time XLM was experiencing a Bullish phase.
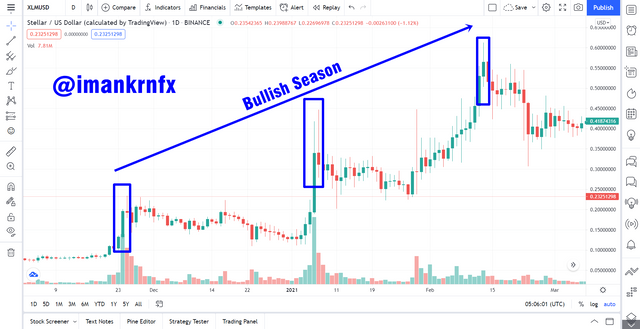
Meanwhile, at different times, XLM has experienced a very sharp decline, and every lowest price of XLM at its closing price has decreased in recent times, this indicates that at that time XLM was experiencing a Bearish phase.
Conclusion
Indicating and identifying patterns on charts is very important in trading and investing in cryptocurrencies. We already know that cryptocurrencies have a very large level of fluctuation, by using pattern identification from the chart we can predict the movement of the cryptocurrency price.
Staking is also a solution for many people who want to benefit by just sitting around at home. This is very suitable for those of you who have some money and want to increase your money.
cc: @imagen
Thank you for participating in the Third Season of the Steemit Crypto Academy.
Congratulations, you made a great work.
Continue to strive, I look forward to continuing to correct your next assignments.