Steemit Crypto Academy Season 4 Beginner's Course - Task 10: Candlestick Patterns.


1a) Explain the Japanese candlestick chart? (Original screenshot required).
b) In your own words, explain why the Japanese Candlestick chart is the most used in the financial market.
c) Describe a bullish and a bearish candle. Also, explain its anatomy. (Original screenshot required)

Explain the Japanese candlestick chart? (Original screenshot required).
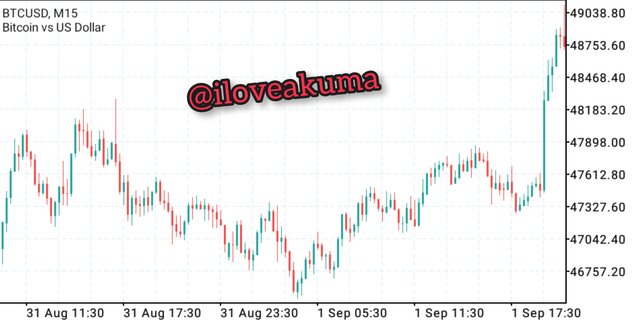
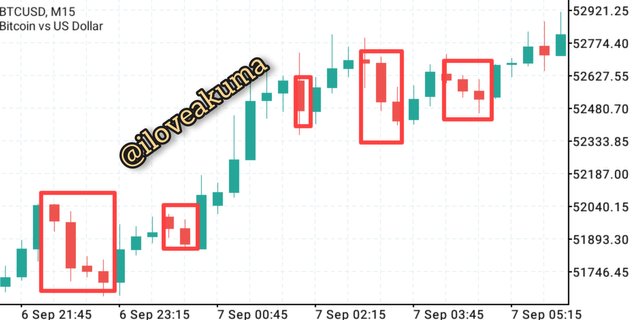
BTC/USD M15 chart from meta trader 5 app
• When demand is more than supply, prices increase because more traders start buying, and this drives up prices. At this point, the market is bullish, and will move upwards indicated by a green candlestick.
• But when supply is more than demand, prices will fall. There are more sellers in the market. Price will move downward which is represented by a red candlestick.
A Japanese candlestick chart captures all these moves in price over different time periods. The chart can be used to predict future changes in price. The chart also has patterns which help traders make trading decisions, it is a very useful tool for technical analysis and overall, the chart helps traders know who is in charge of the market at a particular time (be it the bulls or bears).
In your own words, explain why the Japanese Candlestick chart is the most used in the financial market.
• Easy Identification of Market Patterns: Japanese candlestick charts displays many patterns which cannot be seen or may be very difficult to see on other charts. Patterns such as doji are impossible to see on a line graph.
• Market direction: It is very easy to see market direction on a Japanese candlestick chart. Shapes and colors of candlesticks help traders determine market direction. You can easily spot an uptrend, downtrend, upswing, downswing, amongst others.
• Identifying Price Action: The colors and shapes of candlesticks also helps in identifying price action quickly. You can easily know if it's the bulls or bears which have momentum. This helps in making trading decision.
Describe a bullish and a bearish candle. Also, explain its anatomy. (Original screenshot required)
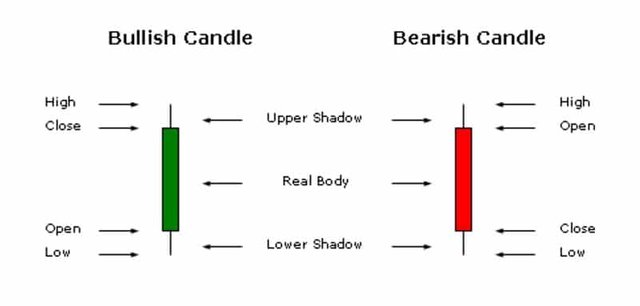
Image source
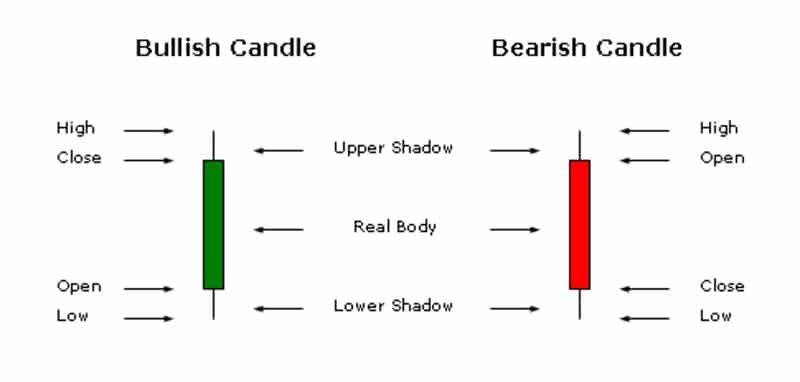
Candlesticks have the function of illustrating interactions between demand and supply in a financial market. It shows different price points over time. There are 2 types of candles; bullish candle and bearish candle.
Bullish Candle
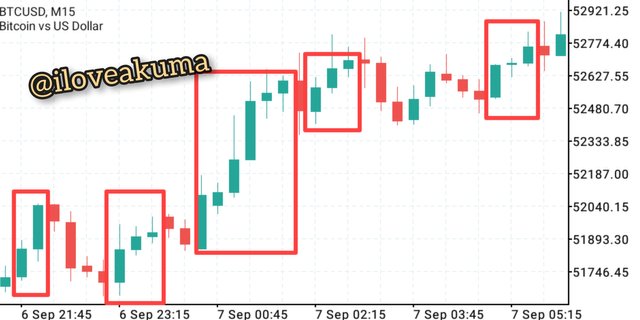
Bullish candles on a BTC/USD chart mt5
A bullish candle means that price opened lower, and closed up higher after some time. A bullish candle always closes higher above the previous candle signifying a rise in price, which means demand is more than supply and buyers are in control.
Anatomy Of A Bullish Candle.
A bullish candlestick has 4 main parts; High, Close, Low and Open. All the parts represent different price points in time.
• Open: This is where the candle begins. It is also known as the opening price. It indicates the beginning of price movement, and a bullish candlestick always opens lower.
• Low: This is the lowest price which was reached during the time period. For a bullish candlestick, the low can be below the open or same price as the open. When the low is below the open, it means that Price opened, then there was selling pressure which drove price below the open. But then, there was buying pressure which drove price back up.
• Close: This marks the end of the candlestick after a period of time. It is also known as the closing price. A bullish candlestick always closes higher than it opened because of buying pressure.
• High: This was the highest price reached during the time period. For a Bullish Candle, the high can be above the close or same price as the close. When the high is above the close, it means that there was buying pressure which drove prices up above the open. Prices rose, then selling pressure drove prices down.
Bearish Candle
Bearish candles on BTC/USD chart
A bearish candle, is a candle which opens at a high price and closes closes at a lower price after a period of time. A bearish candle always closes lower than the previous candle, which means supply is more than demand and sellers (bears) are in control.
Anatomy Of A Bearish Candle
The parts of a bearish candle are; High, Open, Close and Low.
• Open:This is where the candle begins. It is also known as the opening price. It indicates the beginning of price movement, and a bearish candlestick always opens higher.
• HighThis was the highest price reached during the time period. For a Bearish Candle, the high can be above the open or same as the open. When the high is above the open, it means there was buying pressure which drove prices up above the open. Prices rose, then selling pressure drove prices down.
Close: This marks the end of the candlestick after a period of time. It is also known as the closing price. A bearish candlestick always closes lower than it opened because of selling pressure.
Low: This is the lowest price which was reached during the time period. For a bearish candlestick, the low can be below the close or same as the close. When the low is below the close, it means price opened, then there was selling pressure which drove price down. But then, there was buying pressure which drove price back up.
CONCLUSION
I'm very glad that I was able to learn about candlestick patterns. Truly, they are the foundation to understanding technical analysis.
Thanks for reading....