Repost of an uncurated post-" [Trending Market] - Crypto Academy / S5W1- Homework Post for @reminiscence01".
My cryptoacademy season 5,week 1 post for professor @reminiscence01 was reviewed and scored but not curated .
Below is the score from professor @reminiscence01:
"'Hello @iddy , I’m glad you participated in the 1st week Season 5 of the Beginner’s class at the Steemit Crypto Academy. Your grades in this task are as follows:
| Criteria | Ratings |
|---|---|
| Presentation / Use of Markdowns | 1/2 |
| Compliance with topic | 0/2 |
| Spelling and Grammar | 1/1 |
| Quality of Analysis | 1/2 |
| Originality | 1/2 |
| #Club5050 | 1/1 |
| Total | 5/10 |
Recommendation / Feedback:
- The student have completed the assignment for this lesson.
- The student also answered all the questions in his/her own words.
- Your overall presentation is good.
- You have produced a good explanation on Trends. However, you have violated the homework guidelines by using non-crypto chart. This is Crypto Academy and every study here should be related to the cryptocurrency market.
- Please pay attention to homework guidelines.
Thank you for participating in this homework task."'
This is the link for the homework Task:

Image edited in imarkup
Trending Market
Trending Market has a whole lot to do with the price of cryptocurrencies. When the price series of a cryptocurrency continually closes either higher or lower on the average over a specified period,it is said to be trending.
We have upward trending market and downward trending market. In the upward trending market,the price of a specified cryptocurrency fluctuates up and down but on the average tends to close periodically higher. While in downward trending market,the price of a specified cryptocurrency tends to close periodically lower irrespective of interim moves.
Market trends could be bullish or bearish;
(I) Bullish Trend: When crypto market has huge demand-that is those who want to buy a specific cryptocurrency are much,and the sellers are not much,the price of that very cryptocurrency will go high. Bullish Trend tends to move in an upward direction with the price structure of higher-high and higher-low.
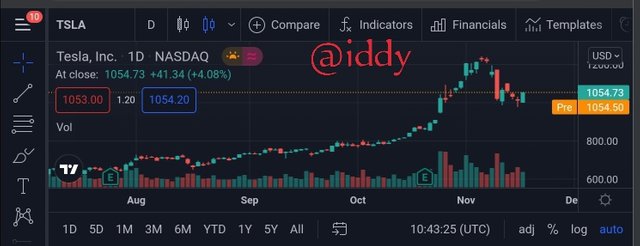
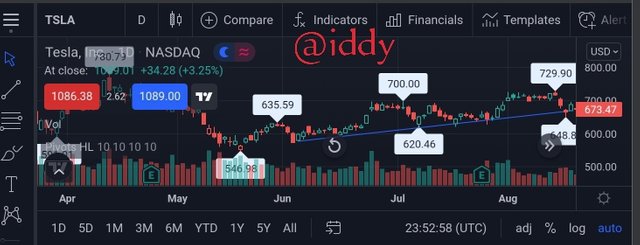
The screenshot above is a screenshot of TLSA/USD chart. From the chart,we can see a bullish movement of TSLA from $600k to $1054.73k. It could be said that TSLA has been in an uptrend from 16Aug'21, with +4.08% at the time of this write up.
(II) Bearish Trend: When there are much sellers of a specific cryptocurrency in the market and the buyers are not much,the price of that currency tends to decrease (go down). Bearish Trend tends to move in a downward direction with the price structure of lower-low and lower-high.
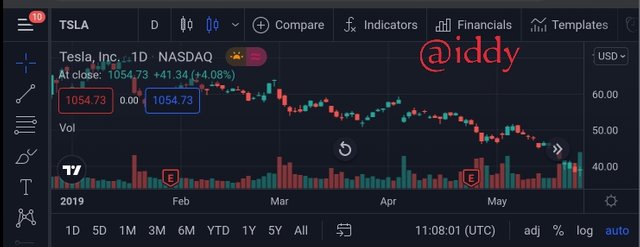
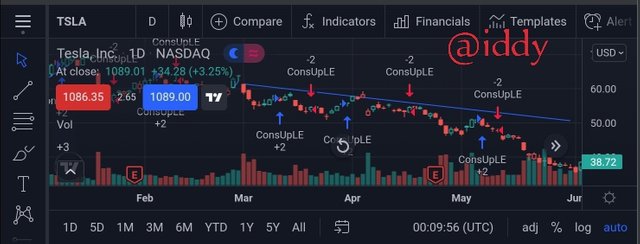
The screenshot above is a screenshot of TLSA/USD chart. From the chart,we can see that from Feb. 2019 to may 2019,the price of TSLA/USD decreased from $58k to $40k-a Bearish movement. It could be said that TSLA was in a downtrend then.
Market Structure
The identification of the current state of market is done in different ways,one of the ways to do so is through the structure of the market.
Market Structure is used for identification of the current state of the market. Making use of market structure helps a cryptocurrency trader to know whether a specified cryptocurrency is in an uptrend, downtrend or ranging.
The use of candlestick chart patterns formed on the chart enables a trader to easily know the market structure of a specified cryptocurrency.
The direction of the candlestick helps a trader to know if the market value of a specified cryptocurrency is in an uptrend, downtrend or ranging. If the formation of the candlestick is in higher-high and higher-low structure,the price is in an uptrend(bullish Trend). If the formation of the candlestick is in lower-high and lower-low structure,the price is in downtrend (bearish Trend). If the market moves within a boundary, that's the candlesticks formation is within the boundary and markets sell at resistance and buy at support,the price is ranging.
Examples:
Bullish Trend: The bullish market structure forms a higher-high and higher-low price structure. The candlesticks which indicates the price of a specified cryptocurrency fails below the previous low-point,but closes above the previous high-point. The formation of bullish market structure indicates the presence of buyers to keep pushing the price of a specified cryptocurrency which leads to an uptrend.
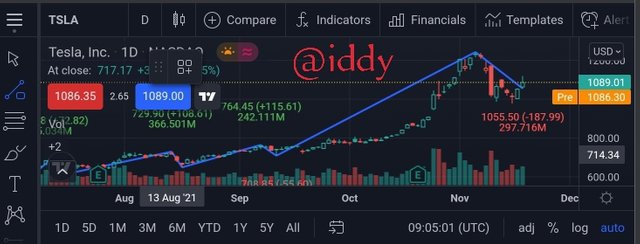
The screenshot above is a screenshot of TLSA/USD chart. Starting from Aug.2021,the price of TSLA/USD fails below the previous low-point but closes above the previous high-point. From the screenshot it can be seen that previous price high-point is 1054.50 and the price closes at 1054.73+41.34(+4.08%), which indicates buyers are still present to push the price. To confirm this,I revisited tradingview.com after some hours and take the screenshot below:
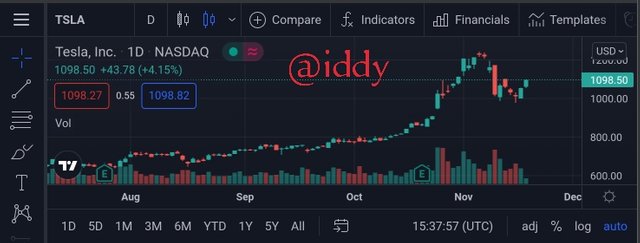
From the screenshot we can see that the price has increased by +43.78(+4.15%) as compared the previous screenshot.
Bearish Trend: In a bearish market structure,the candlesticks form a lower-high and lower-low price structure. This implies that the price of a specified cryptocurrency fails to close above the previous swing high. Similarly,the price of that cryptocurrency breaks the the previous low-point which indicates strong momentum to downtrend. This kind of formation leads to a bearish Trend until the market of a specified cryptocurrency fails to form the lower-high and lower-low price structure.
The above screenshot is a screenshot of TSLA/USD. It indicates bearish Trend,the structure as can be seen is in a lower-high and lower-low formation which indicates a downtrend.
Trend lines
Trendline Is a technical analysis tool used for identification of the current state of the market-that is to know the current market state of a specified cryptocurrency.
This tool helps cryptocurrency traders to identify the direction of the market. Is it in an uptrend, downtrend or ranging? This they will get to know with the use of trendlines.
To know the direction of market with the use of this tool,two low points for an uptrend and two high points for a downtrend are used. If the trendline breaks,it indicates that the current market Value is invalidated.
Examples:
Bullish Trend: In bullish trendline the trading is above the trendline,and the price bounces up each time it hits the trendline. The screenshot below shows bullish trend
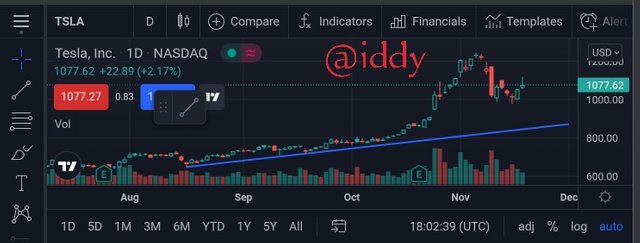
The screenshot above is a screenshot of TLSA/USD chart. When the price hits the line,it bounces up, indicating an uptrend.
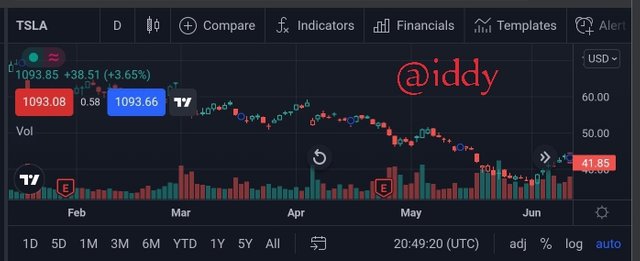
Bearish Trend: In bearish Trend line,the price trading is below the trendline which serves as a dynamic resistance.the price is rejected when hit the trendline,the price bounces backward. The cryptocurrency traders Can have opportunity to keep riding the bearish Trendline until the trendline is invalidated. The screenshot below shows example of bearish Trendline:
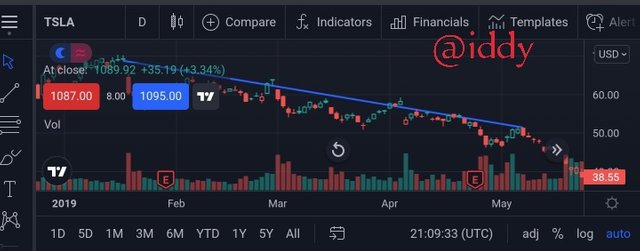
The screenshot is a screenshot of TSLA/USD chart, indicating the movement of price in a lower-high and lower-low formation. This shows a downtrend.
Trend Continuation
Price of and asset i.e cryptocurrency doesn't move in a straight line during a trending market. There are fluctuations and retracements that make the formation of the price structure zig-zag. The retracements come to be as a result of profits taking by the traders for the price to continue in its original direction.
How a cryptocurrency trader can spot Trend continuation using market structure:
Bearish Trend: In a downtrend which is bearish Trend, there's a retracement which forms a high point that is lower than the previous high-point,and a new low-point that is lower than the previous low-point. Any violation to this signals weakness in the trend and a possible trend reversal.
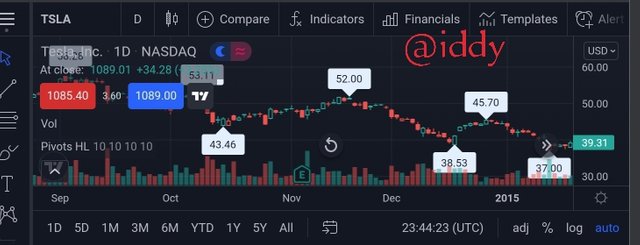
The screenshot above is a screenshot of TSLA/USD. From the screenshot we can that as we move from left to right in the chart,the high points are lower than the previous high-points and the new low-points are lower than the previous low-points. The screenshot shows a downtrend.
Bullish Trend: In an uptrend which is bullish trend,a new low-point that is higher the previous low-point is formed, also a new high-point that is higher than the previous high-point is formed. Violation to this signals weakness in the trend and a possible trend reversal,and shows the presence of buyers to push the price.
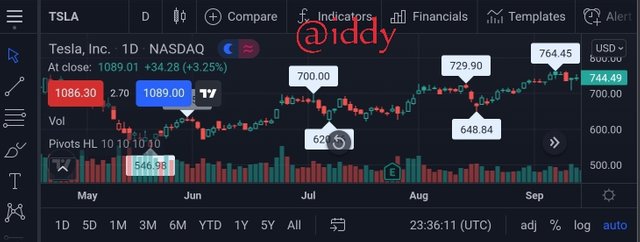
The screenshot above is a screenshot of TSLA/USD. From the screenshot we can that as we move from left to right in the chart,the high points are higher than the previous high-points and the new low-points are higher than the previous low-points. The screenshot shows an uptrend
How a cryptocurrency trader can spot Trend continuation using Trendlines:
Bullish Trend: In bullish trendline the trading is above the trendline,and the price bounces up each time it hits the trendline.During a trending market, price of a specified cryptocurrency retraces back to the trendline and bounces back before continuing the original trend. When the trendline breaks,it Indicates violation of the bullish trend and also signals a trend reversal.
The screenshot above is a screenshot of TLSA/USD chart. When the price hits the line,it bounces up, indicating an uptrend
Bearish Trend: In bearish Trend line,the price trading is below the trendline which serves as a dynamic resistance.the price is rejected when hit the trendline,the price bounces backward.A break of the trendline is a violation of the bearish trend and also a trend reversal signal.
The screenshot above is a screenshot of TLSA/USD chart. When the price hits the line,it bounces down, indicating a downtrend.
Analysing a Crypto Asset Pair to Identify the Current Trend(TSLA/USD)
Th screenshot above is a screenshot of TSLA/USD chart.
(I) Looking at the chart,the market is trending. We can see as the price of TSLA/USD kept creating higher-high and higher-low structure as it hits a new high of $1089.01k as compared to the previous high of $1086.30k.
(II)The trend is a bullish Trend:
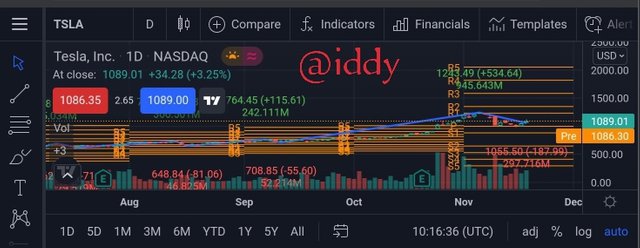
As can be seen from the above chart,the current market condition of TSLA/USD is in an uptrend. The previous high-point is 764.45(+115.61), that's 242.111m,and the previous low point is 708.85(-55.60),that is 52.214m. The current high-point is 1243.49(+534.64), that's 945.643m and current low-point is 1055.50(-187.99) that's 297.716m. As seen the current high-point is higher than the previous,and the current low-point is higher than the previous, which indicates the presence of buyers to keep pushing the price. The trend continues in bullish.
conclusion
In this Task, I have learned trends and how they can be identified using the market structure and trendlines. A cryptocurrency trader having the Understanding trends is an important step in making a good crypto investment. This will enable a cryptocurrency trader to understand the current state of the market and also predict the next market movement. Similarly, trends also give a cryptocurrency a good entry position during retracements/pullbacks. I am very grateful to prof.@reminiscence01 for the elaborate lecture,it wasn't easy but I am happy to learn,I was able to explore market trends, get to learn them,the more I attempted the Questions,the more I learned. Thank you @steemitblog for the golden opportunity.
Thank you!
Cc:
@reminiscence01
Here is my introductory post
