[ SEASON 3 | Week 2 ] Steemit Crypto Academy Homework Post for @reminiscence01 | Introduction to Charts |
Hello friends .... !!!
Meet again with me Ichsan Angga P on this Steemit Crypto Academy Homework Season 3 Week 2.
Today I will finish my homework About Introduction to Charts given by professor @reminiscence01.
What is a Chart
Charts are market price movements that are often used by stock investors and in the world of cryptocurrencies, which charts are used in technical analysis, which aims to see the current market price movements. In analyzing using the chart they will use a period of time for market analysis in order to have a selling target and also a purchase price that is in accordance with the plans of traders or investors. Usually the time of the chart analysis used has a time period ranging from Minutes, Hours, Daily, Weekly, Monthly and Annually, with the aim of carefully analyzing future market prices in order to achieve large profits.
There are many types of charts that are often used by traders or investors in analyzing market price movements, ranging from Line Charts, Bar Charts, Canddlestick Charts and many more. You can use any type of chart to analyze the market you want to trade your assets in.
Explain Japanese Candlestick Charts? (chart screenshot required)
The Japanese candlestick is a graphic representation that resembles a candlestick. It was discovered by a person named Munehisa Homma who was a rice trader in Japan in 1724-1803, at that time Munesa did not find this Japanese candlestick in one day, he did various research and experiments, and until finally his efforts yielded good results, thanks to his discovery he was given the title of a Samurai of Honor and Pride in Japan.
So the Japanese Candlestick is a representation that resembles a candlestick where this chart is very different from other charts, with this Japanese Candlestick we can now do a detailed analysis to see the future movement of the asset.
If we talk about Japanese candlesticks, it's no stranger now, because Japanese candlesticks have become a very common method in their use in the analysis of an asset, because Japanese candlesticks have the best accuracy level because they provide information related to the behavior of movements in the trading market. which we analyze well.
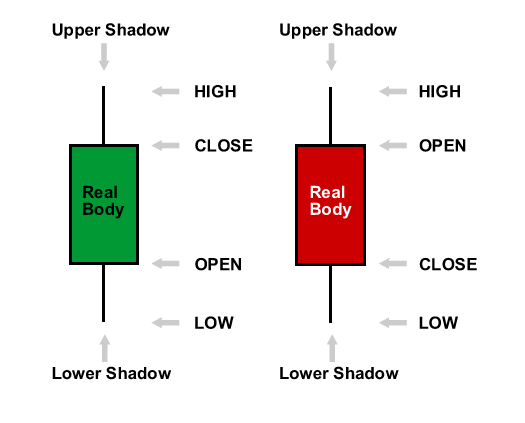
So I will try to give an example of a Japanese Candlestick with a Candlestick image, here's the review :
So I will give an example of a green candle, where on that candle you can see the word "open" so if a chart closes above the "open" open price it will automatically become an asset that is headed up, and is often referred to as "bullish". ". Conversely, on a red candle, if a chart closes at a price below the "open" opening, it will automatically become an asset that is headed down, and we often call it "bearish".
Next you can see on the candlestick that says "Real Body" it is a body of the candlestick, the line at the bottom of the body of the candlestick is called "lower shadow" and at the top of the body of the candlestick it is called "upper shadow". In the "lower shadow" it describes the lowest point in the price of an asset, while in the "upper shadow" it describes the high point for the price of an asset.
Describe the other two types of graphs? (screen display required)
So I will take 2 examples of other chart types, which are as follows:
1. Bar Chart
.png)
XRP/IDR Pair Bar Chart On Upbit Exchange
Bar Chart is a bar chart, in which each bar has information such as open, close, high and low with a time period according to the desired use. This bar chart is a graph that has very complete information related to asset movements according to the review period used, for example here I use the 1 hour timeframe on the XRP/IDR pair, so at the beginning of a timeframe movement it is called "open", then during the 1 hour timeframe it forms the highest price "high" or forms the lowest price "low" and then at 1 hour it ends closing or "close"
This bar chart is a very informative chart, but if you are still at the beginner level, it will be very difficult to analyze and read the information contained in every movement of the bar, if you want to use this bar chart you better learn first first, and I suggest for beginners it's better to just use candlesticks because it's easy to read market movements
2. Line Chart
.png)
XRP/IDR Pair Line Chart On Upbit Exchange
Line Chart is a line chart which is the simplest form, because in this line chart it will only display the closing price, not involving in detail the highest price, lowest price and even the opening price. On the Line Chart it moves with the period you have used, for example you use a 1 hour timeframe, then every 1 hour will end with the closing price. And will continue once every 1 hour.
The Line Chart is so easy to see the movement, because it is not based on the highest, lowest or opening prices, your job here is only to see price movements pointing downwards or upwards in the period you are reviewing, but it has uncertainty so traders are still reluctant to use Line Chart as their method of analysis on the cryptocurrency trading market..
In your own words, explain why the Japanese Candlestick chart is mostly used by traders.
Why are Japanese candlesticks widely used by traders???. Of course it is widely used by traders to analyze the movement of their cryptocurrency assets, because Japanese candlesticks have good and accurate information about price movements in the trading market, ranging from market fluctuations to signals about changes that will occur in the trading market in the future. In the future, besides that Japanese candlesticks are also a method that has been very long and highly trusted by traders in the world and it is also easy to learn Japanese candlesticks when compared to Line Charts and Bar Charts.
So in my opinion why Japanese candlesticks are widely used, the first is because it is a method that has existed for a very long time when compared to Line Charts and Bar Charts, and it is also easy to learn Japanese candlesticks compared to the two methods. So that's the reason why Japanese Candlesticks are so widely used in the world of Cryptocurrency trading.
Describe a bullish candle and a bearish candle identifying its anatomy? (Screenshot is required)
.png)
So in trading an asset, you must know about market movements in the future by analyzing, this aims to achieve big profits, and prevent you from the so-called losses in trading in the cryptocurrency world.
Conclusion
So the Japanese candlestick is a method of analyzing the movement of the trading market that we are reviewing, this Japanese candlestick is a method that has been discovered for a very long time and until now makes it a method that is very widely used by traders in the world, because it is so easy to learn Japanese candlesticks. in and also the information it has is very good and can be said to be accurate, starting from the opening price, the highest price, the lowest price and even signals that give signals about market movements, making Japanese candlesticks widely used when compared to Bar Charts and Line Charts which is so difficult to use this method for a beginner who is involved in the world of cryptocurrencies.
Last word
That's the task that I have completed from professor @reminiscence01 regarding Introduction to Charts In completing my assignment, I realize that there are still many meanings that are far from perfect, therefore I apologize to friends if there are still many mistakes, and hopefully friends will be happy to give good suggestions or input on my posts.
Thank you all, I hope this post can help you all to understand more about Introduction to Charts.


Hello @ichsananggap, I’m glad you participated in the 2nd week of the Beginner’s class at the Steemit Crypto Academy. Your grades in this task are as follows:
Observations:
I'm not satisfied with your answer here. You could have been more technical in the answer.
Recommendation / Feedback:
Thank you for participating in this homework task.