[Heikin-Ashi Trading Strategy]-Steemit Crypto Academy | S4W2 | Homework Post for @reddileep
Hello Steemit:
How are you all, hope you all are doing well. So, today after reading and understanding @reddileep week 2 lecture on Heiken-Ashi trading strategy. After the research on Heikin-Ashi and its strategies, I learned many aspects and things that are essential to minimize the loss in trading cryptocurrencies.
Let's start with the answer to the given questions,

1- Define Heikin-Ashi Technique in your own words.
Heikin-Ashi Technique:
Heikin Ashi represents the average pace of prices. In Japanese, the meaning of Heikin is average and whereas that of Ashi is pace. So, this essentially captures the pace of price. During trending markets, this indicator is very useful and gives you insight into trends and momentum.
Heikin Ashi can be used as a charting method, or as an indicator with candle charts, bar charts, or any other charting techniques. The main advantage of this method is that it filters out the noise from the trend and helps traders identify trending moves better.
Heikin Ashi's techniques take an average of two periods. This technique of combining the previous day and the current day results in a candle with substantially reduces the volatility in price movement and gives out a clear trend.
Usage of Heiken Ashi:
Heikin-Ashi does not have any bullish or bearish patterns. These are simply used to identify,
- Trending periods.
- Potential reversal points.
- Technical analysis patterns.

2- Make your research and differentiate between the traditional candlestick chart and the Heikin-Ashi chart.
Screenshots of both Chart patterns:
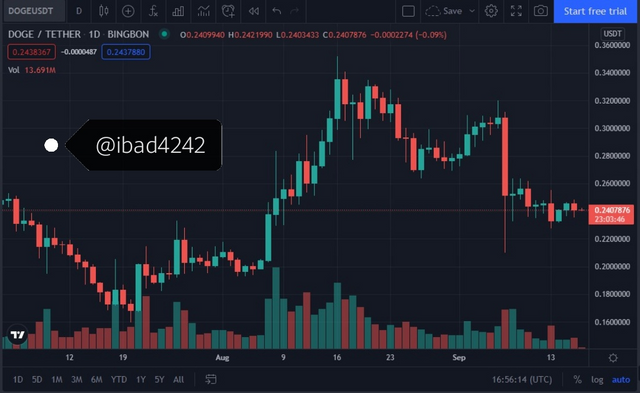
Traditional Candlestick Chart:
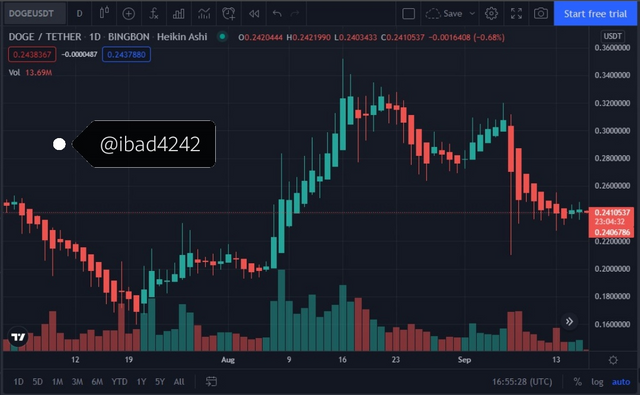
Heiken Ashi Chart:
Difference Between Traditional Candlestick Chart and Heiken Ashi Chart:
| Traditional Candlestick Chart | Heiken Ashi Chart |
|---|---|
| The market trend is not easily identified by seeing the Traditional Candlestick Chart. | Market trend is easily identified by seeing Traditional Candlestick Chart. |
| Traditional Candlestick is noisier than Heikin-Ashi | The noise in the Heikin-Ashi is minimum. |
| When the change in the market occurs, the color of candles changes. | When the change in market trend occurs, the color of candles changes. |
| This chart is more complicated and cannot be easily understandable. | Heiken Ashi chart is easy to understand. |
| When the previous candles close, new candles are created. | New candles are created by some calculations. |
3- Explain the Heikin-Ashi Formula.
For calculating new candles from the Heiken-Ashi technique, these values of previous candles are needed,
- Open.
- Close.
- High.
- Low.
By using these values of the previous candle, new candles are created.
Open:
To find the open of the candle, two values are required which are open value of previous candle and close value of previous candle. The formula of finding the open of the candle is,
(Open of the previous candle + Close of the previous candle) / 2.
Close:
To find the close of the candle, two values are required which are open, close, high, and low of current candle. The formula of finding the close of the candle is,
(Open + Close + High + Low of current candle) / 4.
High:
To find the high of the candle, two values are required which are maximum values of high, open, and close points of current candle. The formula of finding the high of the candle is,
High = Max(High, Open, and Close of current candle).
Low:
To find the low of the candle, two values are required which are minimum values of high, open, and close points of current candle. The formula of finding the low of the candle is,
Low = Min(High, Open, and Close of current candle).
4- Graphically explain trends and buying opportunities through Heikin-Ashi Candles.
Indecision Candle:
Firstly see this chart of BTC/USDT and then I will explain what are good buying opportunities.
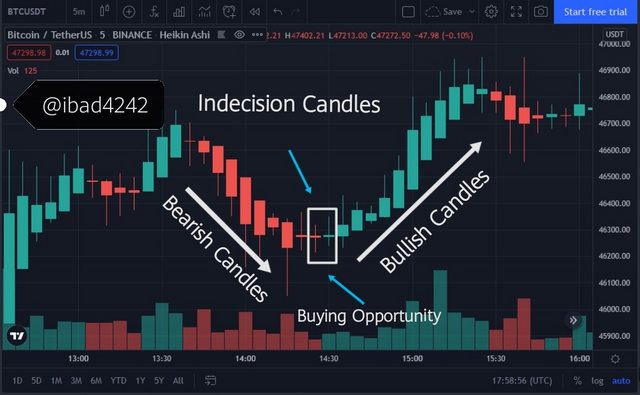
As we all know that, the red color indicates the bearish trend and the green color indicates the bullish trend. In this given example, you see that the trend of the market is bearish but when the indecision cancel changes its color from red to green then it indicates that the trend will become reversal means the price of Bitcoin will go up and it follows the uptrend.
Indecision candles help us to predict the future trend of the market. Traders can easily predict the trend of any coin by observing indecision candles. When the indecision candle changes its color from red to green then the market will go up and when it changes from green to red then the market will go down but this is not 100% perfect.
Price Pull Back:
Pull back signals indicate when the market trend will going to changes its trend from bullish to bearish or bearish to bullish. Let's take an example, see the below image first then I will explain.
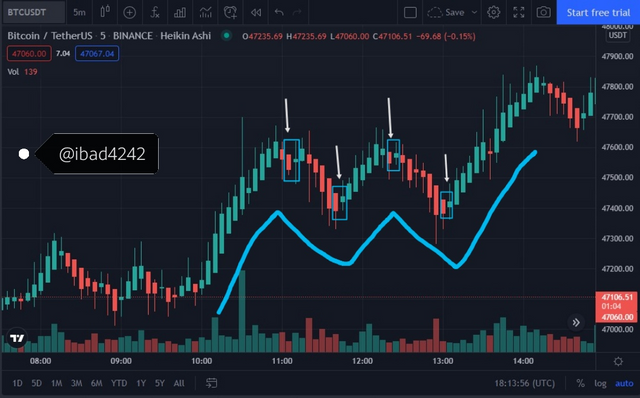
In this bullish market, you can see that candles color change from red to green, and the uptrend is continuing. But when the candle color does not change from red to green then it will indicate that the market will go down and it is a signal of pullback.
5- Is it possible to transact only with signals received using the Heikin-Ashi Technique? Explain the reasons for your answer.
Heikin-Ashi technique is very useful and it helps us to indicate market trends. This technique help newbie because it shows the clear market trend and easy to understand chart candles. But to rely on just one technique makes you in trouble.
As we all know, the crypto world is volatile and unpredictable. So, we have to use some other techniques such as RSI, MAs, EMAs, etc to predict market trends more accurately. If you use the Heikin-Ashi technique with these techniques together, then you will be in a good position in trading.
Besides these techniques, the most important thing is the management of risk capital before trading in the crypto world. With proper risk management of your money, you will have success in this field.
6- By using a Demo account, perform both Buy and Sell orders using Heikin-Ashi+ 55 EMA+21 EMA.
Buy Order:
First I set Heikin-Ashi +55 EMA, +21 EMA on Trading view. Then I have to use BNB/USDT pair and a 5m time frame.
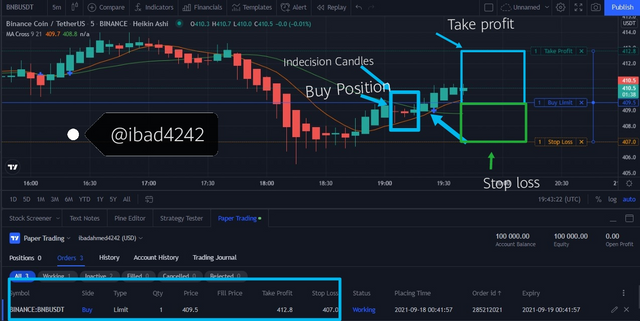
When I saw an indecision candle color changes from red to green then I made a decision and buy just after the indecision candle. Then I set stop loss below the 55 EMA line indicator. I also set a take profit at the previous indecision candle level.
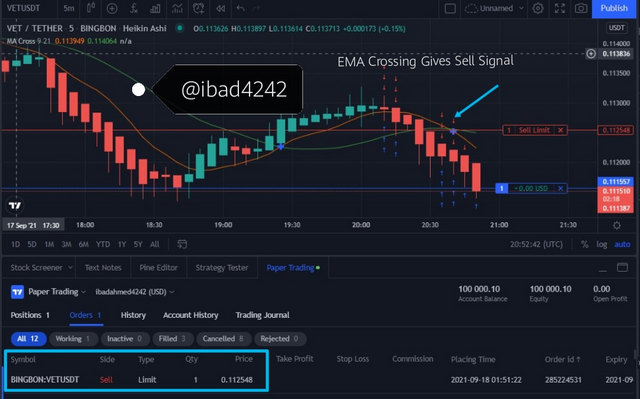
Sell Order:
For this, I use VET/USDT pair and 5h time frame on the Trdaing view. When the Heikin-Ashi candles indicate the bearish market which means indecision candles color changes from green into red. I set a sell entry just after the indecision candles. When the EMA lines cross each other, that is a signal of a bearish trend because the lines after intersect each other go down.
Conclusion:
Heikin-Ashi technique is an advanced version of the traditional candlestick chart. It helps new traders to read charts easily and understand the behavior of the market. Heiken-Ashi is used to predict the trend of the market by seeing indecision candles. With the help of the Heikin-Ashi technique, traders can maximize their profits.
As we all know that nothing is perfect, Heikin-Ashi isn't 100% perfect but it is an easy and effective technique. But if traders use this technique with other useful techniques then it will give benefits to them.