Crypto Academy: Season 3 || Week 7|| TradingView || Homework Post for @yousafharoonkhan

As-Salamu Alaykum

Defining the TradingView site and how to register an account in tradingview? What are the different registration plan? (Screenshot necessary)
The world as we live in now is revolving and so it is in the trading world. With the implementation of various trading sites, one can easily sit in the comfort of his or her home and have access to all kinds of trades online. Due to this new approach, one site stands out due to its robust nature, which is TradingView.
TradingView is an online trading site where traders and investors use it to monitor and analyze the prices of Forex pairs, digital currencies, stocks, and a variety of other tradeable assets, such as government bonds. As it stands, tradingview is designed specifically for investors and traders, but it is a very versatile platform which can be used by all types of traders, such as forex traders. On the official site of tradingview when launched, users are given the opportunity to view trading ideas which were published by other traders and can serve as an avenue for people without any prior knowledge of trading to learn and practice. Tradingview is known among the trading community for its variety of analytical tools that can be used in one’s trade and it is very unique.
How to Register an Account On TradingView
To register an account on tradingview has been made very simple and user-friendly. The account creation is in two forms: the paid account and the free account. I will be using a free account for this demonstration. To be able to do that, follow these simple steps.
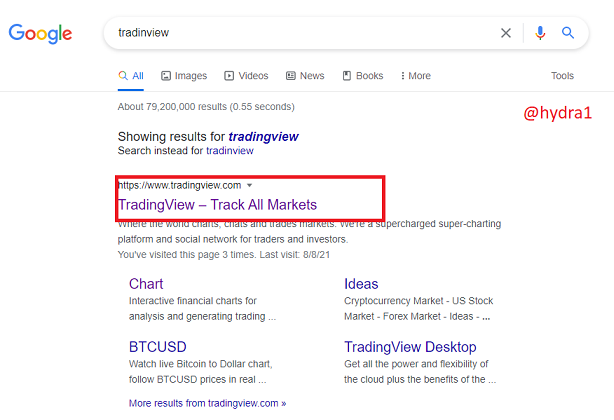
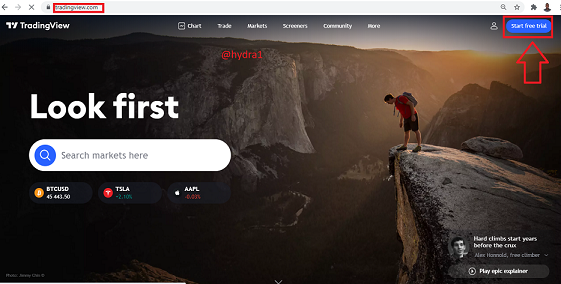
- Launch your browser and search for tradingview or visit their official URL Tradingview
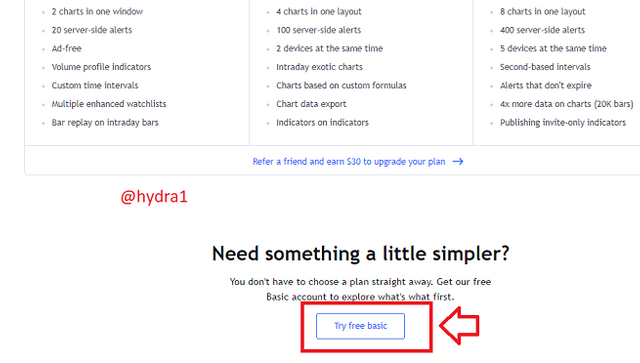
- Click on start free basic and and click try basic
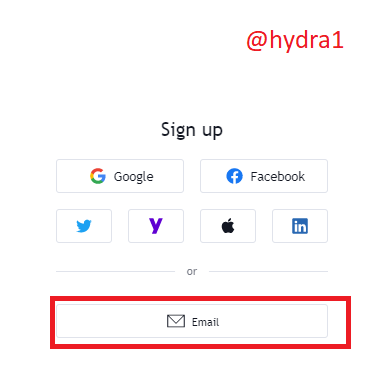
- Choose the option you would like to use, whether facebook, Twitter, Yahoo, email, and many more. For this, I will choose the email option.
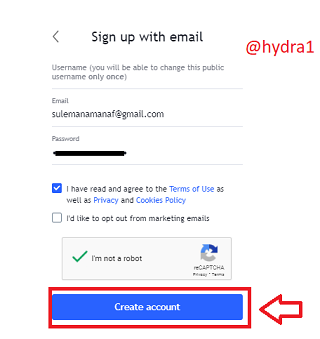
signup form
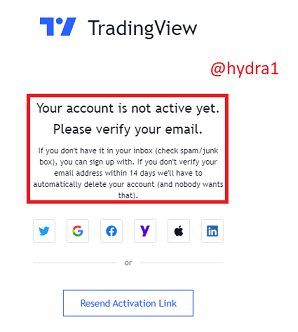
verification email sent
- key in your correct email address and password, check the terms of use box and click on create account.
Verification email
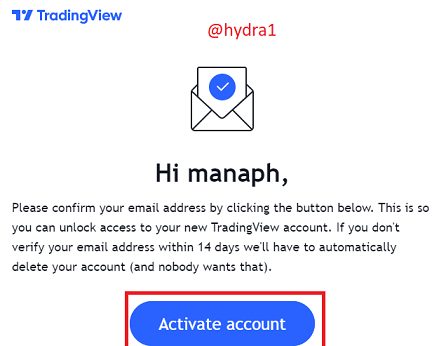
- check your mail and verify the verification link sent for the account to be verified and activated.
What are the different registration plans?
Trading View offers two different plans; the free version and the paid version.
The paid Version
The paid version is further divided into monthly subscriptions and yearly subscriptions.
Monthly subscriptions have also been categorized under three (3) options;
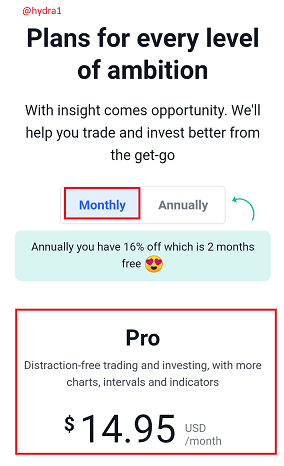
- Pro: This plan is being billed at $14.95 per month accompanied by its features.
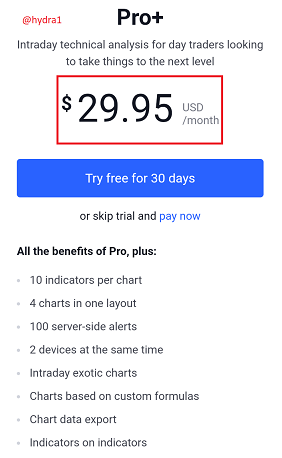
- Pro+: This plan is also billed at $29.95 per month with more features than the pro.
.png)
- Premium: This plan is billed at $59.95 per month with many more features than the Pro+.
Annual
This version is also categorized into 3 yearly subscription plans, namely;
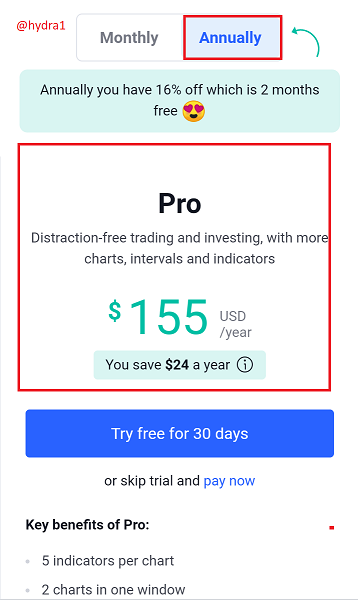
- Pro: This plan is being billed at $155 yearly with a discount of $24.
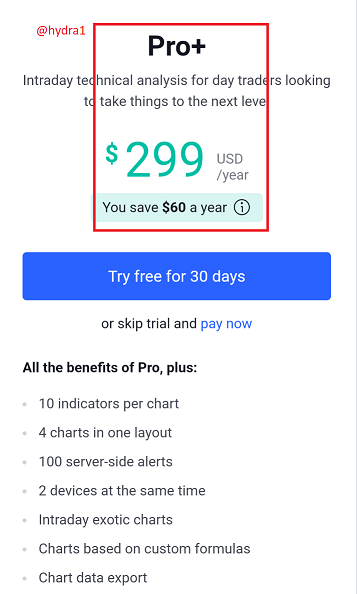
- Pro+: This plan is also billed at $299 yearly with a discount of $60.
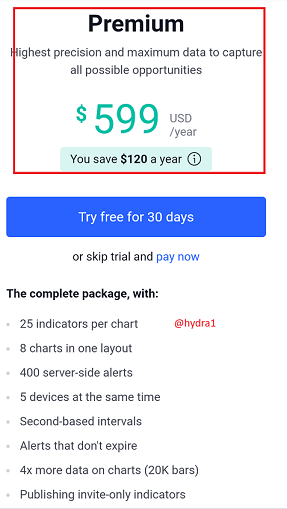
- Premium: It is billed at $599 yearly with a discount of $120.
Explain the different features of tradingview and what is your favorite and why?
Tradingview has got so many features and I will be discussing some of the features as to what they do.
MARKETS
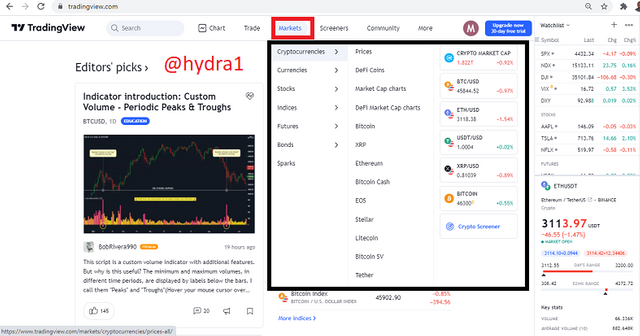
markets
market in details
The market feature on the trading view site is located right after the trade feature. This feature enables us to know the various kinds of markets that are available, which include, cryptocurrencies, currencies, stocks, indices, futures, bonds, and sparks with their respective market prices, and they are as well arranged based on the market capitalization that they have.
CHARTS
As we all know, charts are very essential to every single trade that we make, and tradingview has got us covered by offering us such a feature. This feature follows the search box on the tradingview site and to use this feature you only have to click on the Chart button. This feature takes into account the live performance of any assets within a specified period, represented on a graph commonly using a Chinese candlestick. It also gives us the opportunity to add other various analytical tools, such as technical analysis, indicators, and trend reversals, to be able to make an accurate trading decision.
TRADE
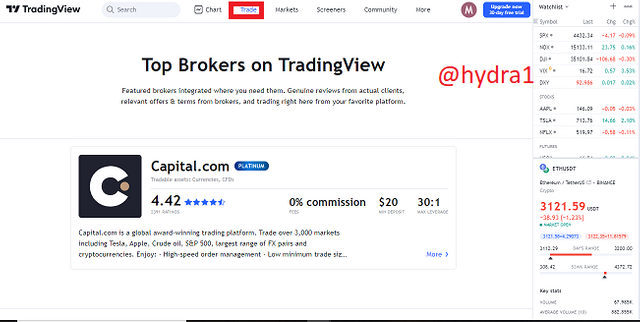
This feature follows the chart feature, which provides us with more information on top brokers and the various commissions they offer.
SCREENER
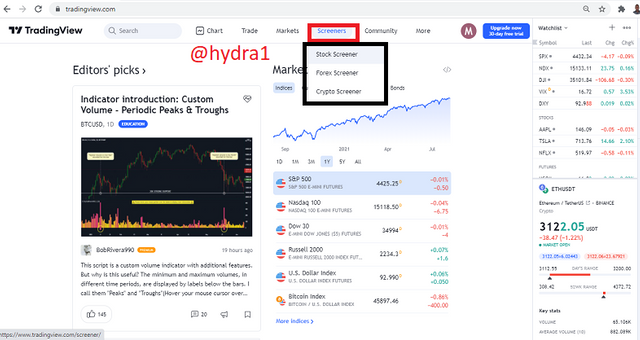
screener
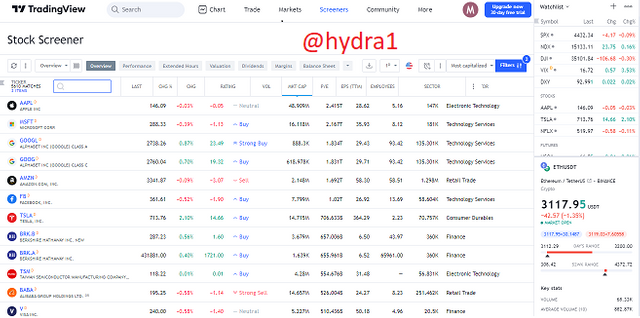
stock screener
The feature follows the market feature and it basically provides us with 3 categories, namely stock screener, forex screener and crypto screener. It basically gives us the various changes the assets went through in the last hour, taking into consideration the percentage change, low, high and volume of the various assets.
My Favorite Feature and Why
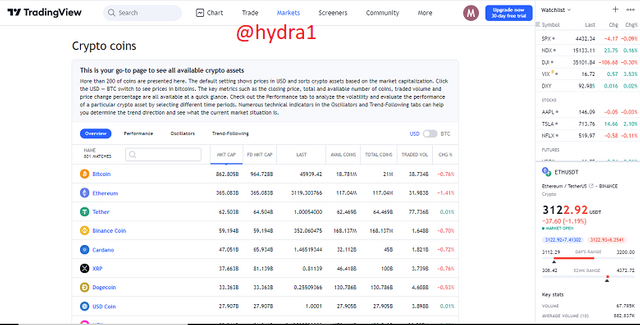
My favorite feature is the market feature. It provides more information about all the assets we can think of ranging from Cryptocurrencies all the way to sparks, which in actual sense, gives us the opportunity to diversify our portfolio.
How to set a chart in Tradingview and use two tools to edit it.
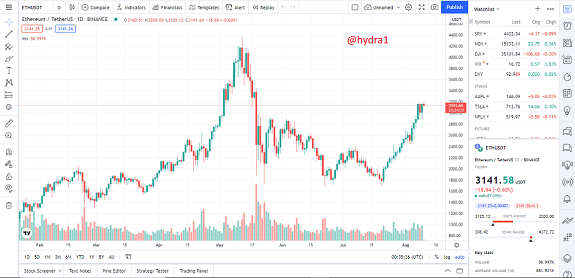
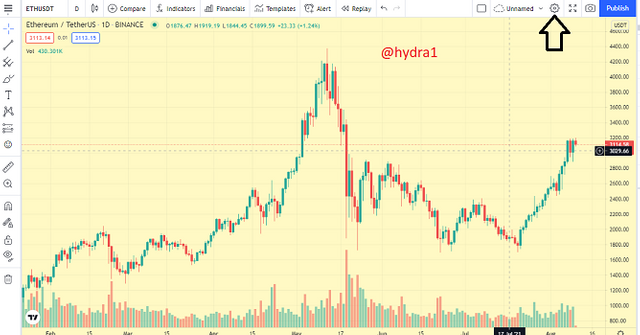
- Click on the chart and select a pair of your choice. I have selected the ETHUSDT as my preferred option.
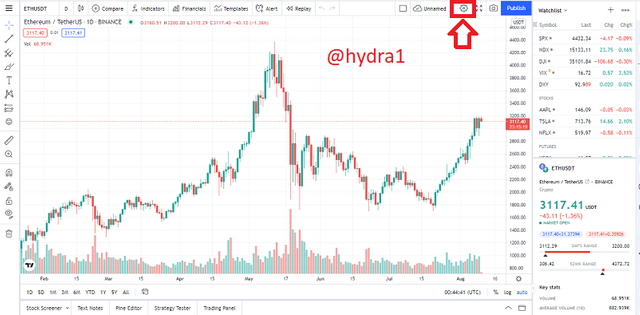
- First, I will be changing the appearance of my chart. That is the background color. Click on the setting.
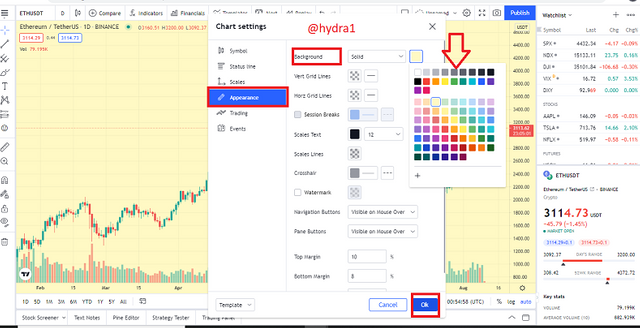
Next, you will be presented with the various formatting tools. Click on the appearance and under the background, you click on the solid and change the background color of your choice. Click on OK for it to be formatted.
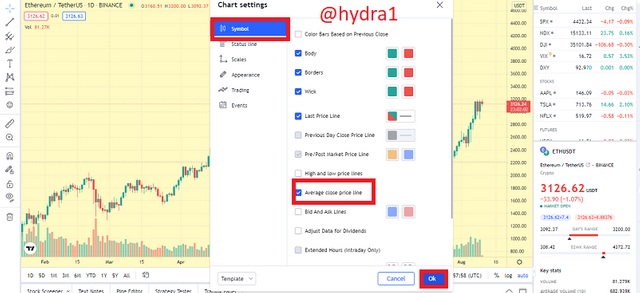
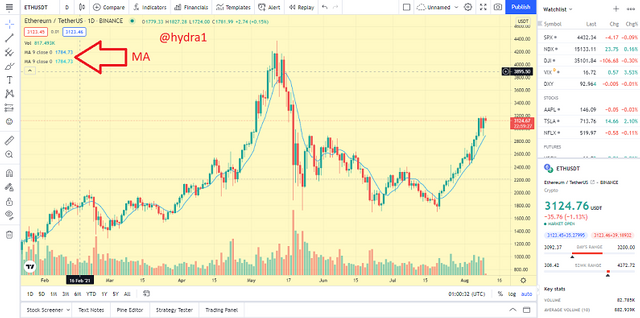
The next tool I will be using to set my chart is the average close price line.
- Click on the setting, which you will be presented with the various formatting tools as well.
average price line added
- Next is to locate and click on symbols. From the symbol dropdown menu, locate and check the average close price line and click on ok for it to be added onto the chart.
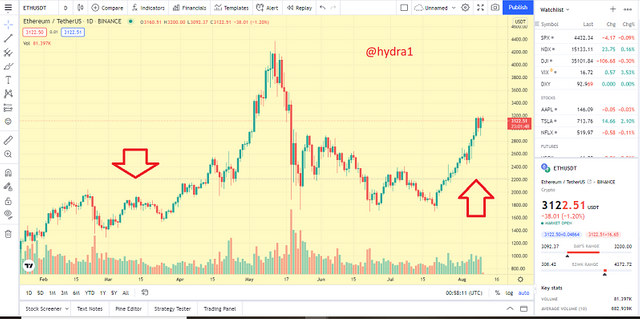
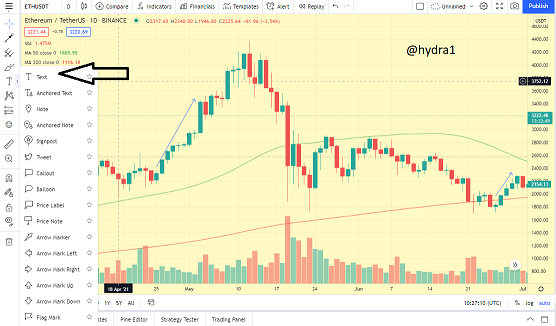
From the chart above, I want to indicate the upward trend of the market.
![]()
- To your left you will find some of the tools used to format the chart. Select the arrow button, then drag it onto the trend you wish to indicate and release the button for it to be added.
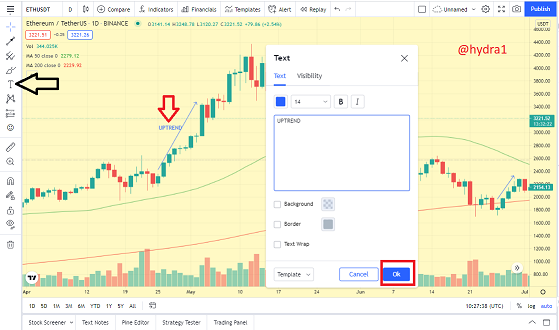
uptrend text added
- Now after indicating the arrow, I would like to also add a text indicating the uptrend. From the tools, click on the text button and click on where you want to add the text. Type in the text and click on okay.
Explain How to add indicator in chart, what is your favorite indicator and why?
In regards to this, I will be adding two moving averages (MA) to my chart as my favorite indicators to show a Golden Cross and a Death Cross, which basically indicate the movement of the market, whether it is an up trend or a down trend.
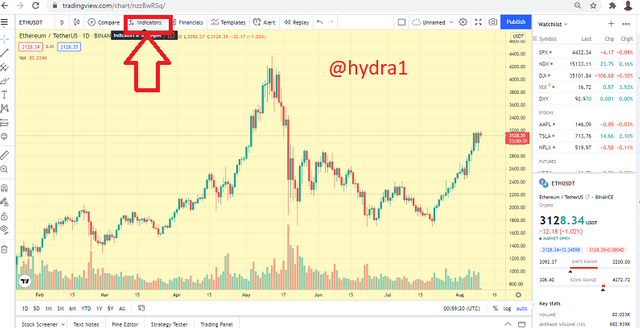
- After clicking on the chart and selecting the asset of your choice, click on the (fx) symbol.
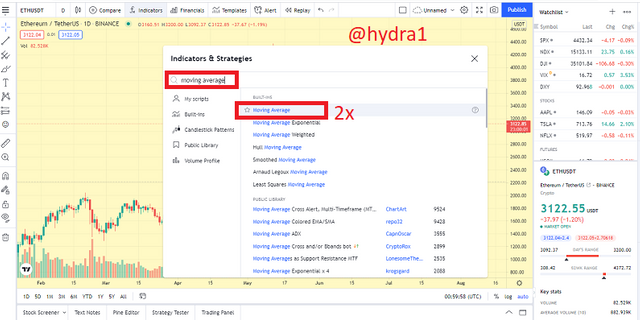
From the drop-down list of indicators, search for Moving average and click on it twice (2x) for it to be added.
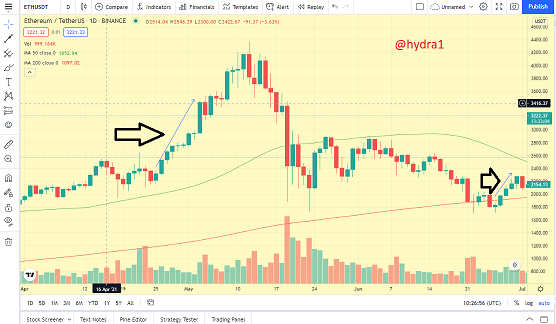
On the first moving average, click on its settings. You then click on the input and key in the 50 day moving average. Click on style and change its color to green. Click on OK.
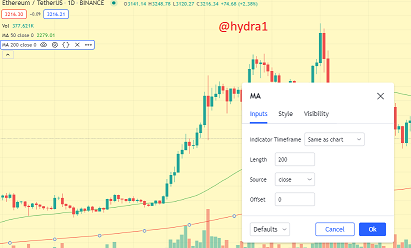
- Next, you click on the second moving average setting, click on input and key in the 200days moving average. You also click on the style and change its color to red and click on OK for it to be added.
MA
- At this point, the two-moving average, the golden and death cross have been added successfully. The Golden cross typically indicates a trend shift from a down trend to up trend, which signifies a bullish market, whilst the death cross indicates a shift from an uptrend to a down trend, which signifies a downtrend and, for that matter, a bearish market.
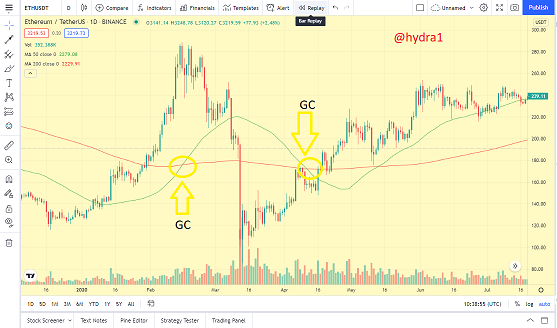
Golden Cross
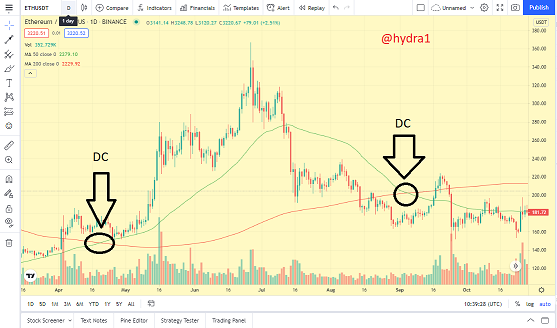
Death cross
This indicator is my favorite indicator because it signifies to traders the kind of trend we are in or will be experiencing, and for that matter, traders will be aware of whether to dip a toe into a particular asset or to exit the market. Simply put, traders are able to have a better understanding of the market and make a decision on whether to sell or buy more and hold it for a future rise in price to make more profit.
Do you think TradingView is useful in predicting the market for cryptocurrencies?
In my opinion, tradingview is very useful in predicting the market for cryptocurrencies, in that when a variety of tools and indicators are used in the confirmation of a conviction of the market, it is able to predict the markets. For instance, the use of golden and death crosses, when used, gives us much more information about the current movement of the market, whether it is going to be a bullish market or a bearish market, and thereby prepares us for it.
CONCLUSION
To conclude with, this lecture has been one of the best lectures as the concept of tradingview site has been made simple to understand by our able professor. Tradingview is an exciting web site to use as it is used by many traders to trading analysis with diverse tools and features and the sense of belonging to tradingview community is tremendous for both new and old traders and people who are yearning to learn much trading are being given the opportunity to learn and practice hat they learn.
Thank you.
Respected first thank you very much for taking interest in SteemitCryptoAcademy
Season 3 | intermediate course class week 7
you post is well written, you explained every points very well, it is true that golden cross and death cross give us information about trend of market, in limited days, so
every feature of tradingview is very much helpful , i think that trading view is one of the best place , for new and old trader to gain access to best market price chart, there are many feature like market that help the trader to research before invesment in any coin
thank you very much for taking interest in this class