Steemit Crypto Academy | Season 3 | Week 7 [Homework post for Professor @kouba01] Trading Crypto with Average Directional Index (ADX) Indicator
What is ADX indicator, how is it calculated, how to use it and much more. Everything will be answered in this assignment post.
1 Discuss your understanding of the ADX indicator and how it is calculated? Give an example of a calculation. (Screenshot required)
A very known man named J.Welles Wilder created this indicator. The Average Directional Index or commonly known as ADX indicator lies in the category of technical oscillators. We can get the strength of the trend that is occuring in the market. What does that mean? We can determine whether the trend is in a bullish or a bearish phase as well as we can ascertain how strong that particular trend is.
When we add ADX to any crypto chart we can take help with two other lines which are DI+ and DI- (though the ADX can be used separately, the DMI lines give us the directional movement of the trend)
These two lines come in handy when we are trading. When the price of the asset goes up we notice the DI+ is above the DI- line and similarly when the price of the asset goes down the DI- is noted above the DI+
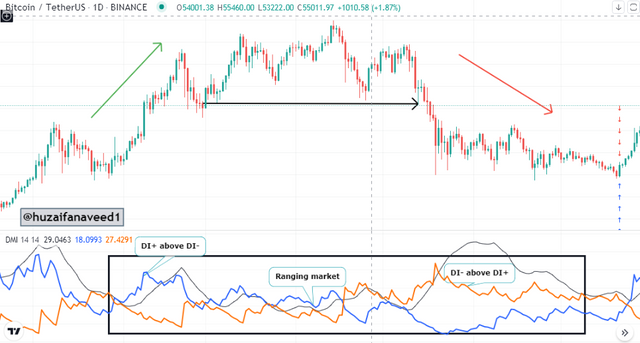
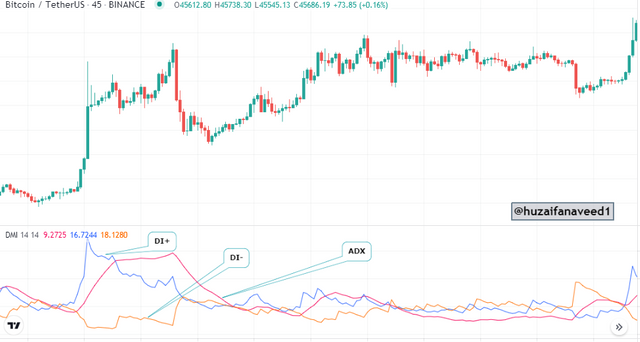
In this demonstration above of the BTC/USDT chart we notice that when the price is in an upward direction the DI+ is above the DI- line and when the price is in downward direction the DI+ is below the DI- line.
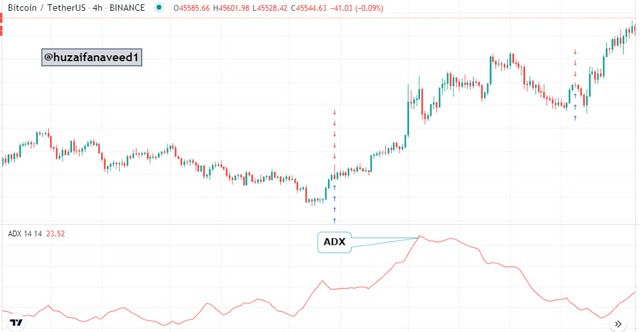
The ADX indicator can be measured from the values between 0-100. The values are based on the strength of the trend.
| ADX Value | TREND'S STRENGTH |
|---|---|
| between 0-25 | Weak trend or absence of trend |
| between 25-50 | Strong trend |
| between 50-75 | Very strong trend |
| between 75-100 | Extremely strong trend |
The values in the table above give us an idea of the values of ADX and the strength of the market. When the value of ADX is below the 25 level mark, it is probably a ranging market with no significant trend. With the increase in strength of trend the value also increases above the 25 line.
trending market
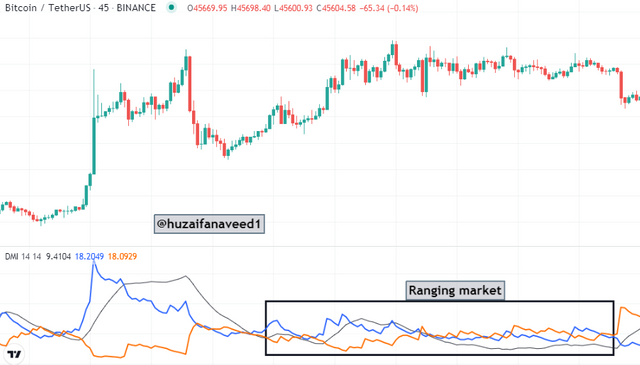
Ranging market
Calculation of ADX indicator
It might seem like a difficult process but its quite easy. For the calculation of ADX we will need:
True Range:
The True range is calculated by
Current High minus low
Current High minus Previous close
Previous Close minus Current low
The biggest value of these will be taken as the True range.
- DMI+ & DMI-*
DMI+= The DMI+ is calculated by substracting the Previous High from the Current High.
DMI- = The DMI- is calculated by substracting the current Low from the Previous Low.
DI+ and DI-
to get the DI+ and DI- values we need to divide the respective DMI values from the true range value.
DI+ = DMI+ / True Range
DI- = DMI- / True Range
ADX
using all the calculations that we devised above, we can get the formula of the ADX.
ADX = Number of period (n) x (DX) / number of period (n)
DX = [((DI+) - (DI-)) / ((DI+) + (DI-))]
So;
ADX = Number of period (n) [((DI+) - (DI-))/ ((DI+) + (DI-))]/ Number of period (n)
Example:
Lets assume the values of any particular crypto asset:
Current High = 10.50
Current Low = 6.50
Previous High = 6.50
Previous Low = 4.00
Previous close = 4.50
Period= 1
DMI+: (10.50 - 6.50)
= 4
DMI-: (4 - 6.50)
= -2.50
DMI+ = 4
DMI- = 0
TRUE RANGE: [(10.50 - 6.50)] [(10.5 - 4.50)] [(6.50 - 4.50)]
- (4) (6) (2)
TR = 6 since it is the biggest value.
DI+ = 4/6
= 0.66
DI- = 0/6
= 0
- ADX =
1[((0.66) - (0))] / [(0.66)+(0)] / 1
= 1(0.66)/(.066)/1
1 (1) / 1
ADX = 1

2 How to add ADX, DI+ and DI- indicators to the chart, what are its best settings? And why? (Screenshot required)
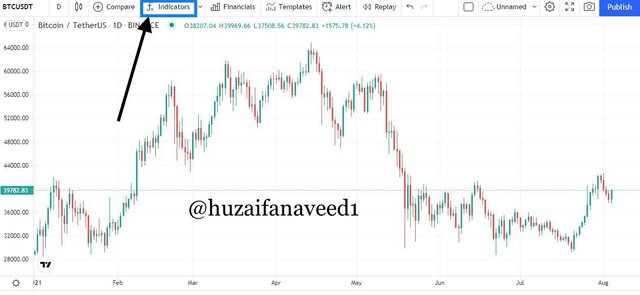
I'll be demonstrating this from the tradingview.com
Select any crypto pair of your choice and click on the fx indicators option on the top
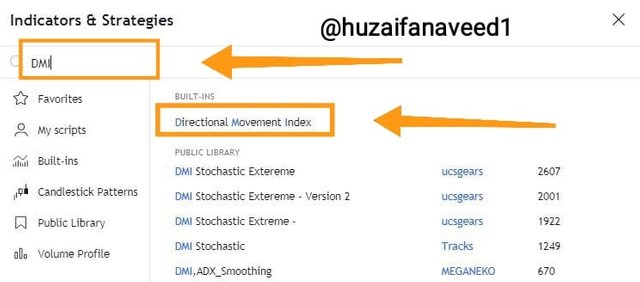
Type Directional Movement index or Simply DMI. Click on the indicator.
The indicator will be added on your chart. To alter the options. Click on the settings option on the indicator.
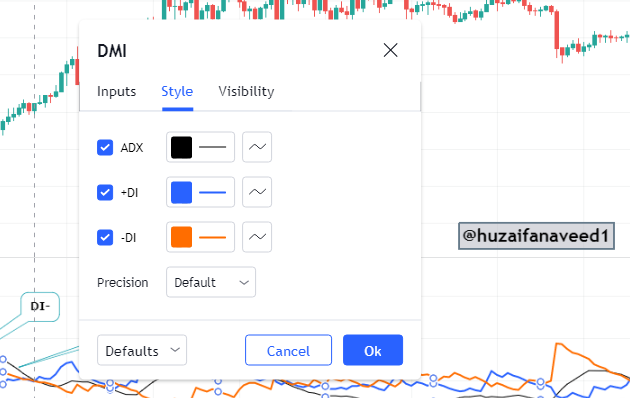
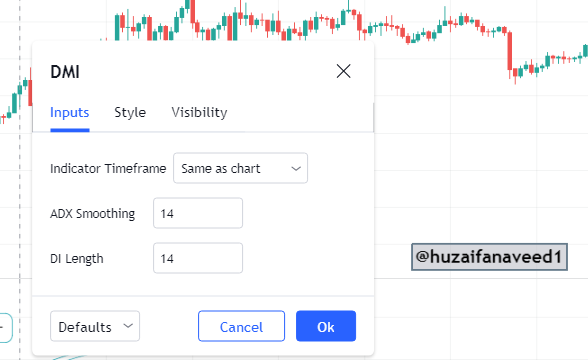
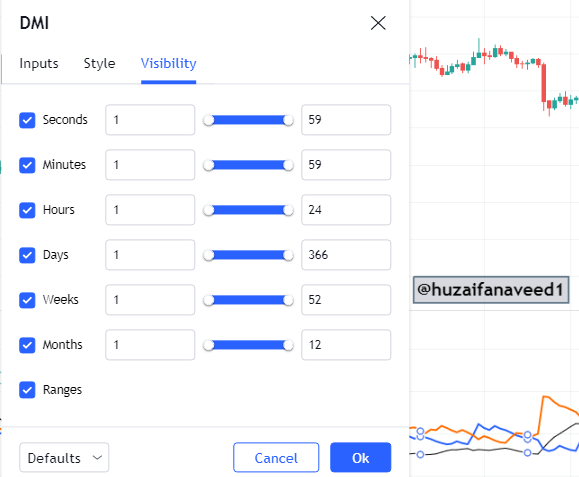
Here we have three options:
Style: from here we can change the color or the thickness of the lines. I changed the color of ADX line to black and increased the thickness of DI+ and DI- for my own convenience.
Input: in this option we can change the timeframe and the length. By default it is 14
Visibility: here we have weeks days hours minutes seconds. I kept them at default.
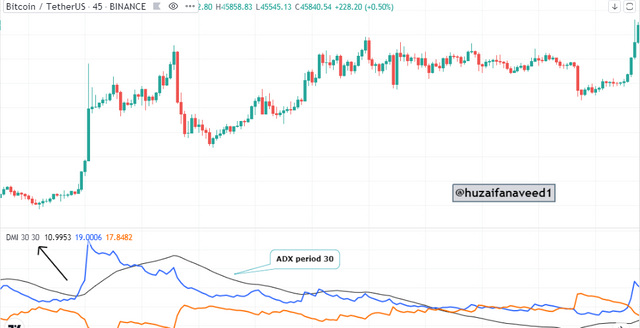
Best settings to use:
The ADX on a longer time frame such as the 30 period responds Comparatively slowly to changes in price. The 30 period gives slightly less frequent signals. But when we use the 30 periods which means it takes last 30 periods in consideration, the fluctuation will be less as well and the signals will be more reliable.
In the lower time frame such as the 7, the ADX will give us recurrent quick signals but due to high volatility of the market, the signals could be wrong as well. Therefore low settings are less reliable than the large setting.
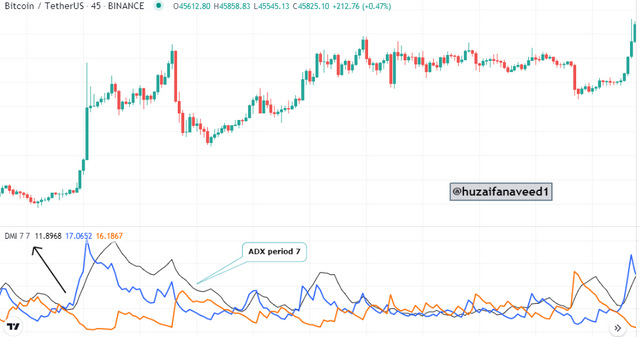
It is advisable stay in the range of 7 to 30 periods. When the period is set to low there will be more opportunities for you to have your trades but there are chances of wrong signals as well, and when the setting is increased, you will get less fluctuation and more reliable indications.
It all depends on your trading style. For example you are a scalp trader you can use low settings to get quick indications. But always keep in mind that there are chances of wrong signals in lower setting so it would be my advice to take use of other indicators as well while scalp trading on lower settings.
If you are a swing trader, ie, you hold on to your assets for quite some time, you could go with the higher setting such as the 30 periods. This would be more reliable for you.
3 Do you need to add DI+ and DI- indicators to be able to trade with ADX? How can we take advantage of this indicator? (Screenshot required)
Trading alone without the DI+ and DI- lines and only using the ADX line is like you have an opportunity to cash out your profits and yet you still chose not to. The ADX indicator can be used alone or with any other indicator on the DI lines.
The ADX indicates us the strength of a trend. It does not help us in identifying the direction though. Now, this does not mean that you cannot use the ADX alone. You can, and it actually gives strong signals of the strength of the trend but still if you use it with the DI lines you will he able to get the directions as well
ADVANTAGE OF DI LINES
The DI+ line helps us in indicating the rising Trend along with the strength of this rising trend with the ADX. The DI- line helps us in indicating the fall of a trend alongside the strength of the fall with the ADX.
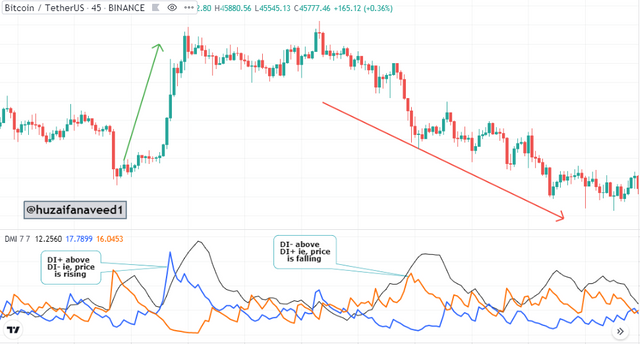
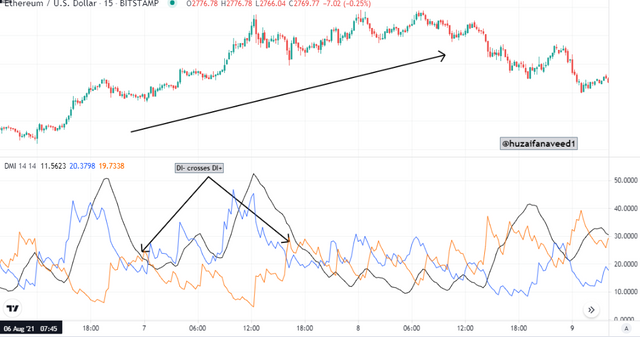
In this demonstration above we can notice when the DI+ crosses the DI- in the upward direction, the price of the asset has also moved upwards. And when the DI- line crosses the DI+ line the price of the asset has also moved downwards.
BUT, as told by the professor in the lecture that the meagre crossing of the DI lines should not be considered as buy or sell signals, as they are quite responsive to slight changes in the market and sometimes might not give correct signals.
4 What are the different trends detected using the ADX? And how do you filter out the false signals? (Screenshot required)
As told in the question 1 as well we use the ADX to identify different trends in the market. They could be weak trends, strong, very strong and even extremely Stron trends. Lets look at them separately.
Weak Trend
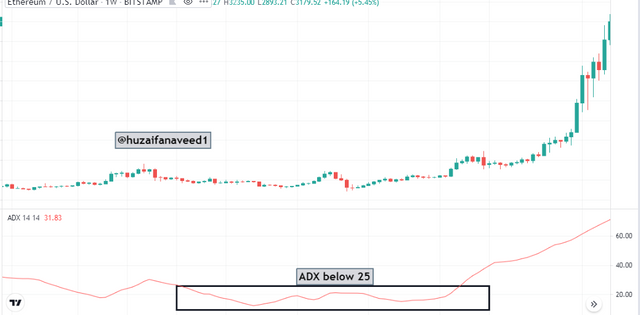
When the ADX value is less than 25 it is considered as a weak trend. This ohase in the market is usually ranging and there is no significant upward or downwaed movement, instead a sideays movement. The market is in a consolidation phase, ie, the phase before the formation of any trend in the market which could be a bearish or a bullish.
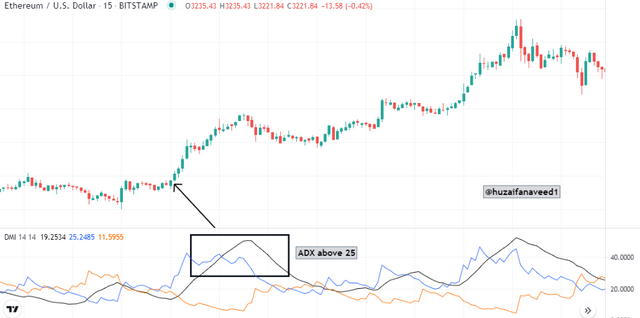
When the value of ADX is between 25-50 it indicates that there is a stron trend.
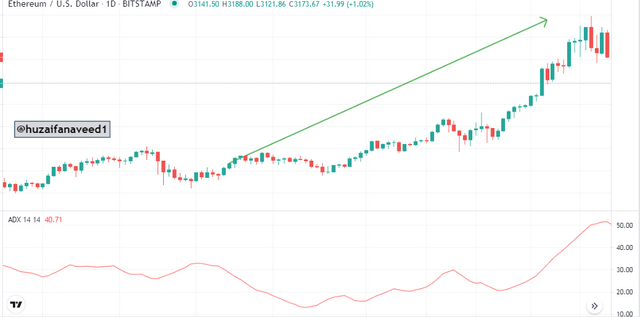
In this demonstration above we can notice that the ADX line has risen from 25 upto 50.
Very Strong Trend
When the ADX line crosses 50 upto 75, it indicates a very strong trend. The line, however will not cross 75.
In this demonstration we can notice a very strong trend of ETH/USDT
Extremely Strong Trend
This is when the ADX cross above 70. It is very rare and it identifies high volatility in the market as well
Filtering Out False Signals With ADX
There are quite some ways to filter out false signals while using ADX
- Periods
Using the correct period is the most vital point in my observation. When we use the 7 period it might give us quick indications but there is a high chance of false signals. When using the 30 period we will get delayed signals due to which we might miss out on trading oppurtunities.
That is why the 14 period is recommended to use as it migh help you in identifying false signals.
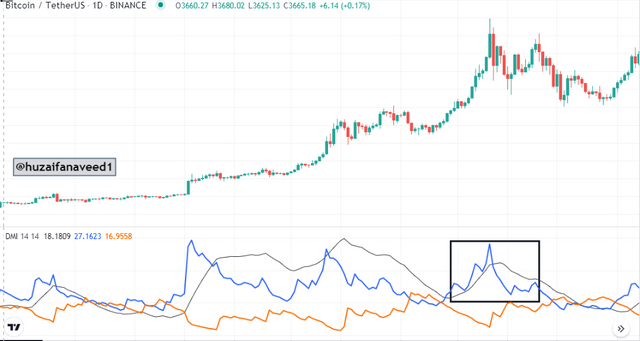
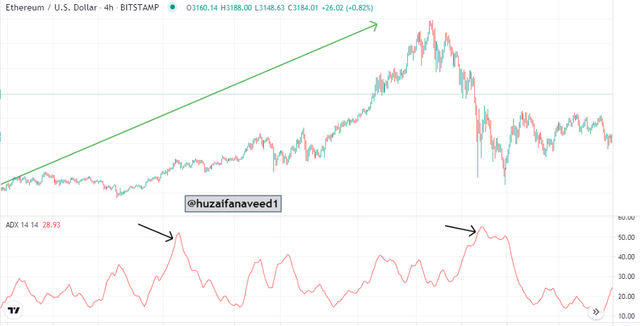
False Reversal Signal
Sometimes the ADX line gives a false reversal signal while the price is actually rising. One such example was seen in the BTC/USDT chart
Here you can notice that while the price is rising, the ADX gave us a lower high which was a false signal.
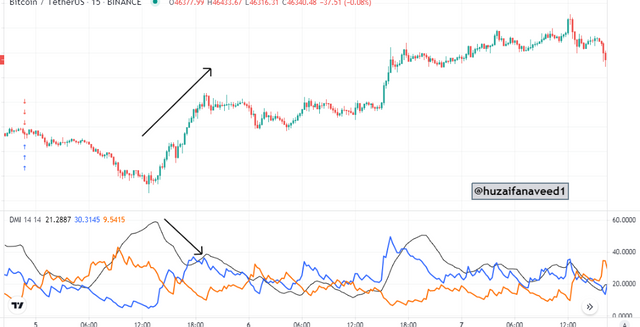
DI+ DI- false signals
As already told that many traders take the crossing of DI+ and DI- without actually having a look at the market as a buy or sell trade signals. It is not always the case. Sometimes there are false signals. As seen in the chart below.
The DI- line crossed the DI+ line which many traders would have thought a sell signal but the market continued in an uptrend.
5 Explain what a breakout is. And How do you use the ADX filter to determine a valid breakout? (Screenshot required)
Breakout refers to the break of the previous support and resistance levels. The market breaks out in the upward direction when it breaks the previous resistance level and in downward direction when it breaks the previous support level.
Using ADX to filter correct Breakouts
Using the Adx for determining breakouts we need to see where the ADX line stands. If it is below 25 and there is a breakout then it is a false breakout as ADX is in a weak trend.
Lets have a look at some breakouts using ADX
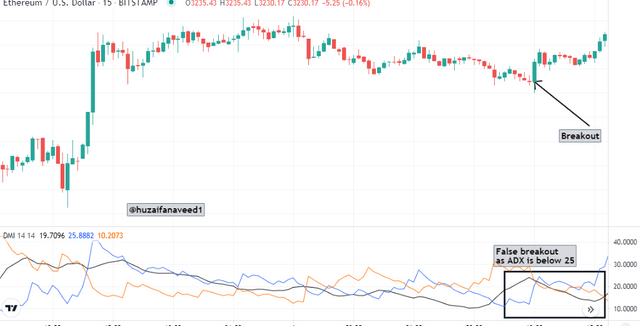
In ETH/USDT chart we see that the price was moving sideways with some bearish candles. We obeserve a bullish candle and might have thought that this is a breakout but when we see the ADX it is below 25 so it is a False Breakout
Another example of a breakout using the ADX. There was a ranging market with a few bearish candles. We observe a bullish candle which indicated a potential breakout. When we observe the ADX line it was above 25 and we establish that this is a valid breakout.
So in this way we can filter out false breakouts using ADX.
6 What is the difference between using the ADX indicator for scalping and for swing trading? What do you prefer between them? And why?
ADX IN SWING TRADING STYLE
Swing trading refers to holding on to your assets for days or weeks.
Now, trading with longer period with ADX we can get reliable results but they might be a bit delayed as well. Advisable is to use other indicators alongside the ADX, which we have learned in this season only such as the Ichimoku-Kinko-Hyo, RSI and Bollinger Bands. But when using other indicators with ADX you need to keep in mind that the signals you are getting are alligned with each other.
Furthermore in swing trading there will be a sort of peace in the market as you will be using higher period and there will be less fluctuation giving you good entry and exit signals.
ADX IN SCALP TRADING
In scalp trading which means making quick decisions in the market ADX can come in handy as well. The ADX can be used to determine the strength of the trend while with DI+ and DI- lines we can determine the directions as well.
But keeping in mind that in smaller periods and time frames there are chances of false signals as well as there is a lot of noise and volatility in the market. The ADX could be used with a 100 period and you may also use some other similar indicators such as the RSI or MACD, as per your convenience, this will you can filter out fluctuation in the market. For scalping the 5 min or the 1 min timeframe could be ideally used which will assist you in leaving the market with good profits.
I would personally like to carry out swing trading with the ADX as I will have more entry and exitimg oppurtunities as well as there will be less volatility in the market. The strength of the market could be analysed by the ADX and the direction with the DI lines. I would also use other indicators such as the RSI and MACD as I find them the most convenient for me.
An extensive lecture in which we learned all about the ADX indicator.
The ADX indicator is a stron trend identifying indicator which gives us the strength of the trend. It can be used with the DI+ and DI- lines to tell us the direction of the trend.
This indicator is used to have good trading decisions as we can also filter out false breakouts using ADX. Furthermore there are multiple trends in the market which can be detected using the ADX such as weak trends, strong or very strong trends.
If the ADX is below 25 it is considered as a weak trend and if it is above the 59 it is considered as a very strong trend.
All in all this was a very informative lecture professor @kouba01
I enjoyed making it, hope you had a good read as well
Ps: all pictures were taken from my tradingview account
Regards,
@huzaifanaveed1

Hello @huzaifanaveed1,
Thank you for participating in the 7th Week Crypto Course in its third season and for your efforts to complete the suggested tasks, you deserve a 7.5/10 rating, according to the following scale:
My review :
Good content article in which you covered the topic in all its aspects where the answers were clear. I have some notes:
A simplified and understandable explanation of the indicator and its use.
The final operation is ADX = Sum of n [((DI +) - (DI-)) / ((DI +) + (DI-))] / n, So to get the correct ADX result, you need to calculate DX values for at least n periods then smooth the results.
Your answer on how to extract false signals and identify breakout points with ADX indicator was not deep in terms of analysis and illustrative examples.
A superficial explanation of two ways to trade the ADX indicator, as you confined to stating generalities without going into more details.
Thanks again for your effort, and we look forward to reading your next work.
Sincerely,@kouba01