Starting Crypto Trading - Steemit Crypto Academy |S6W1 - Homework Post for Professor @pelon53

Q1. In your own words, what is fundamental analysis? Do you think it is important for a trader? Justify the answer.
In the world of cryptocurrencies, it is very important to first understand the type of analysis that is very Essential before you invest in a coin. There are basically two types of analysis which we will cover in the subsequent questions.
- Fundamental Analysis:
We know that the Crypto market is a very volatile market and one bad move or one bad decision will most likely disrupt your whole portfolio. This is when the Fundamental Analysis comes in handy. The fundamental analysis is also known as the macroeconomics analysis consists of a lot of things that we will discuss below.
Fundamental Analysis refers to digging deep down into the project that you want to invest in and then making a decision. For example, one of the factors of fundamental analysis involves checking out the white Paper of the project. Or on the other hand, analyzing the Consensus Algorithm of the project makes a coin stand out from the other projects. I'll give you an example of a coin so that you'll have a perfect understanding.
For example, there's a coin called the ADA(Cardano) this coin works on the Proof of stake that is considerably better than Proof of Work. In the Proof of Work consensus algorithm, huge energy is required due to which miners have to sell their assets. The Cardano blockchain gets the better of these issues with the PoS in which the miners have the mining power according to the percentage of coins that they have staked. The traders who have ADA coins also have a stake in the Cardano ecosystem in which they can get rewards for staking. This is one of the reasons why ADA attracts traders for investing in this coin. So you see how the fundamental analysis, in this situation helps the Investors in getting a complete overview of a coin.
Apart from that fundamental analysis, includes other things such as the condition of the economy such as inflation that is going on in the world, which might increase the selling of any commodity or the interest rates, any affiliation of the project with any sports team or any other big industries, for example, the health industry. I'll give you a very good and very important example of how fundamental analysis works while looking out for a token.
There's a fan token known as the PSG fan token which is associated with one of the footballing giants called the Paris Saint Germain. Some months ago Lionel Messi joined PSG in the football transfer market. This transfer took place on the 10th of August 2021 and it had such a big effect on the PSG fan token that its price surged immediately.
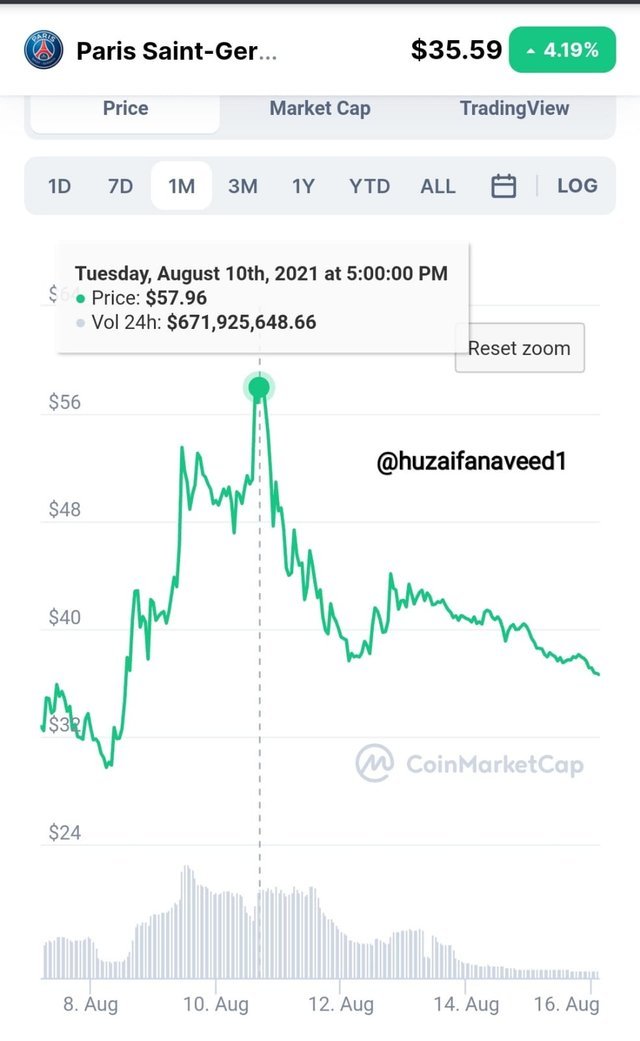
coinmarketcap
So, having good know-how of the project that you intend on investing in is a very important factor of the fundamental analysis.
Other than that, the fundamental analysis includes the listing of a coin on any exchange which can affect the price of the asset. You have to be very alert on these topics so that you have a perfect fundamental analysis. Listing of a new coin on any bug exchange, such as Binane Kucoin, etc affects the price of the coin. The new listings can be checked from here.
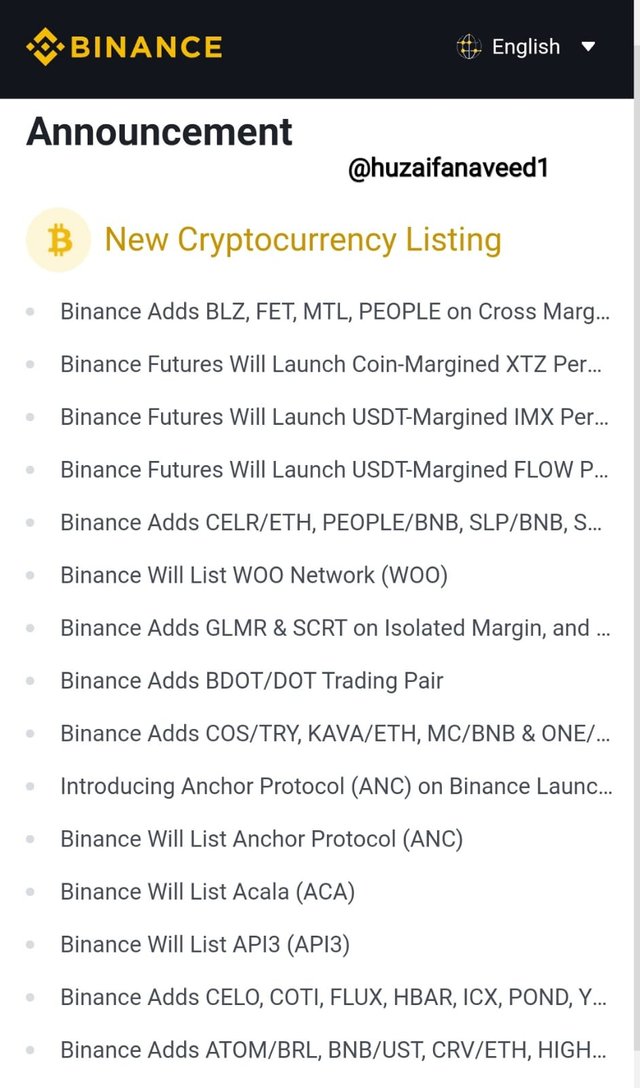
binance
Is fundamental analysis important for a trader?
YES. It is absolutely very important for you to do a fundamental analysis before investing in any coin. You have to check for the whitepaper, the consensus algorithms. The project's affiliations with different companies and much more.
We all know how volatile the crypto market is. One minute it's up, the next minute down, so to have a better grip on your trades, fundamental analysis is the key. The most important thing associated with fundamental analysis is the peace of mind that you get. For example, if you are confident about any project and have done your fundamental analysis on it, then if even there is some volatility in its price, you won't be concerned as you know that it is a solid project and it will be profitable to you.

Q2.Explain what you understand by technical analysis and show the differences with fundamental analysis
Technical Analysis:
Technical analysis is another type of analysis that is very important while trading. It involves the usage of different indicators for determining the price of an asset. The most important factor, at least for me of having technical analysis is Risk Management to minimize my losses.
Technical analysis involves finding out the movement of the price of an asset over time. This type of analysis could be done in any time frame. Then one of the most important factors in the technical analysis is the use of the support and resistance lines which help you in determining the movement of the price. You can see if the price breaks the resistance line, it is a good time to invest in it as it is on an upward rise. Or you can observe the Bounce back of the price of the support line.
For me, the most important part of technical analysis is to use the indicators to the best of my use. The parameters of the indicators should be set cautiously to give the best results. In technical analysis, you can use more than one indicator at the same time to have better and more efficient results. Through your technical analysis, you can set Buy stops and sell stops which will help you in effective trading. For instance:
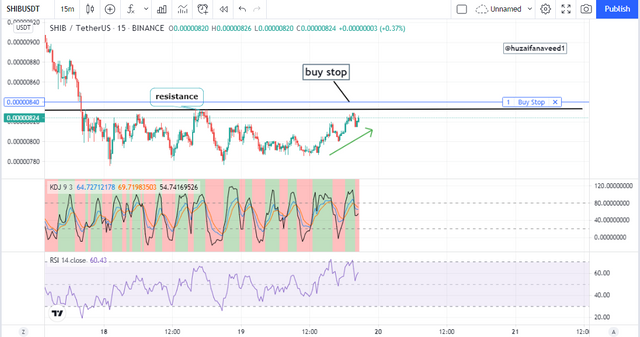
In this chart above of the Shib/usdt I have effectively used two technical indicators to my use. The RSI and the KDJ. Both give me a positive indication of the upward movement of the trend so I placed my buy stop to maximize my profits.
Difference between Technical and Fundamental Analysis
| TECHNICAL ANALYSIS | FUNDAMENTAL ANALYSIS |
|---|---|
| It is governed by using different tools and by previous price movement | it focuses more on the underlying conditions of the project. |
| The analysis is done there and then on the chart | involves different information such as the conditions in the market, etc |
| Focuses more on the volume of the asset, trends, etc. | Is affected by much bigger factors such as the country's economy, rates, etc |
| It is very helpful for quick trading | fundamental analysis helps you out in long term investments |
| The past prices of an asset involve technical analysis | The current situation of the project involves the fundamental analysis |
Q3.In a demo account, execute a sell order in the cryptocurrency market, placing the support and resistance lines in time frames of 1 hour and 30 minutes. Screenshots are required.
For this question, I'll be using the Tradingview platform to execute a sell order by using the support and resistance lines.
1st Sell Order on 1H Timeframe (Steem/USDT)
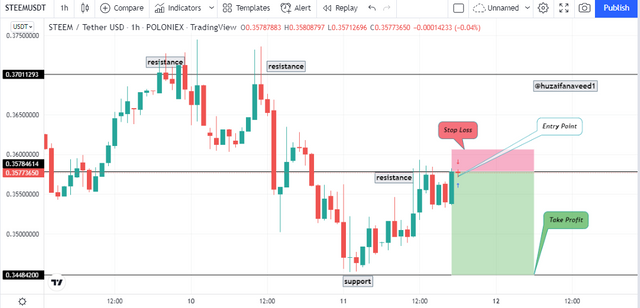
In this Steem/Usdt chart I observed the price was rejected by the resistance. I saw this as a perfect opportunity to place my sell trade. The take profit was at the nearest support while the support above the resistance.

2nd Sell Order on 30m Timeframe (TRX/USDT)
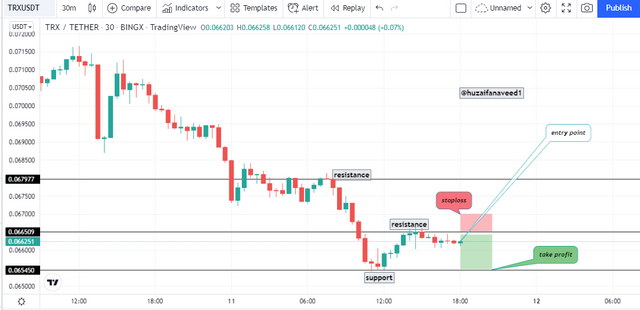
In this TRX/USDT chart above I noticed the price moving towards the resistance. A rejection was incoming so I placed my sell trade. With the stop loss a bit above the resistance and the take profit at the support. The trade was executed.

Q4. In a demo account, execute a buy order in the cryptocurrency market, placing the support and resistance lines in time frames of 1 day and 4 hours.
1st Buy Trade on 4H Timeframe (Luna/Usdt)
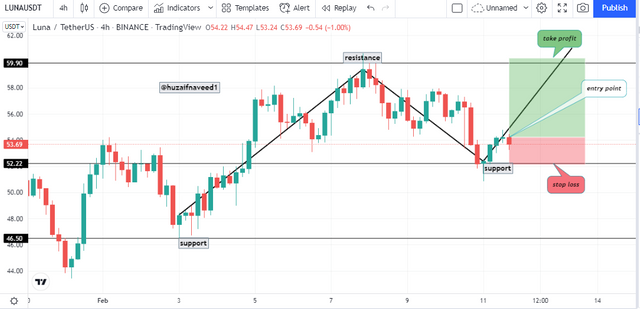

A perfect scenario of Break retest break on Luna/Usdt was observed above. I placed my buy trade as the price is expected to move and break the resistance. The take profit was placed slightly above the resistance while the stop loss on the support. The trade was executed.
2nd Buy Trade on 1D Timeframe (Bake/Usdt)
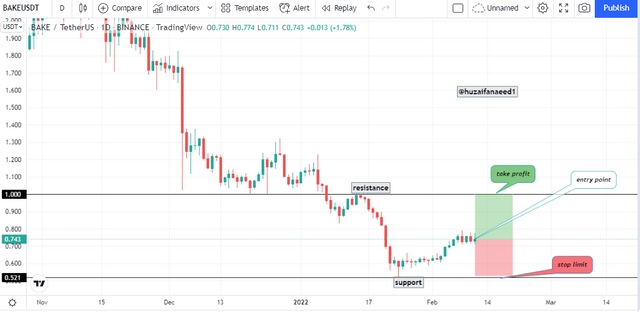

In this demonstration above of Bake/usdt I found the areas of support and resistance. I observed the price on an upward movement and placed the order. The Take Profit was at the resistance while the Stop loss at the support. The order was executed.
Q5. Explain the “Hanging Man” and “Shooting Star” candlestick patterns. Show both candlestick patterns on a cryptocurrency market chart. A screenshot is required.
The Hanging Man.
The hanging man can be observed in the Japanese candlestick charts often. The hanging man is a very important indication and we will see how.
Hanging Man is formed at the end of an uptrend which basically means that there is a price reversal coming. It consists of a short body and a long wick which is the lower wick. Whenever a hanging man is observed it is due to the increase in the sellers' pressure as the buying pressure is diminishing.
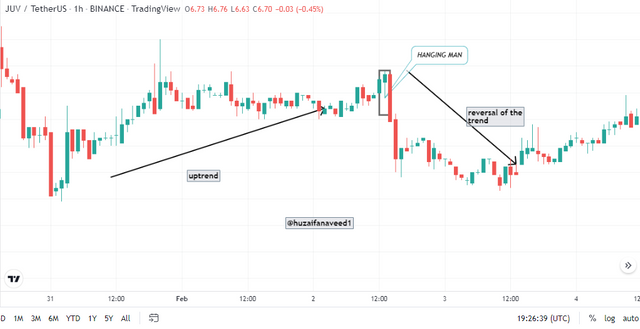
As you can see in this example above as soon as we found the hanging man, the trend reversed in the bear direction
Shooting Star
The shooting star is the complete opposite of the hanging man yet when it shows up in an uptrend it indicates the trend reversal as well. It is characterized by a small body and a long upper wick.
The shooting star is formed when the buying pressure is overcome by the selling pressure in the market. Which is characterized by a weak bullish pressure and then a sudden strong bearish movement. Let's look at the example of the shooting star below.
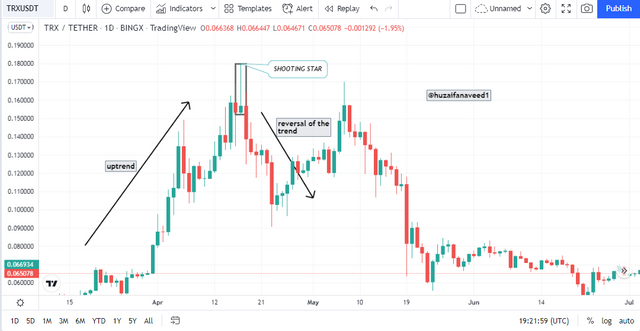
The trend reversal can be observed as soon as the shooting star was observed in the chart.
A crypto market is no joke and we need proper preparations for any trade that we are about to make. The analysis could be done in two ways, ie, Fundamental Analysis and Technical Analysis. Fundamental Analysis is done when you look out for the factors that can affect the credibility and the prices of an asset while Technical Analysis mainly focuses on reading the charts with good indicators and trading techniques
The candlesticks come in handy in trade and especially their indications such as the trend reversals by the Hanging Man and the Shooting Stars. Thank you professor @pelon53 for this interesting lecture. I enjoyed making it hope you had a good read as well.
Ps: all screenshots were taken from tradingview.com while the grammar has been checked from grammarly
Regards,
@huzaifanaveed1
