[Crypto Trading With Chaikin Money Flow Indicator]- Crypto Academy S4W6 - Homework Post for professor @kouba01
Hello there everyone. We are back in the 6th week of the CryptoAcademy and this week we learned the Chaikin Money Flow Index. This will be my assignment post.
Q1. In your own words, give a simplified explanation of the CMF indicator with an example of how to calculate its value?
Chaikin Money Flow Indicator
The Chaikin Money Flow was named after its inventor Chaikin Marc. The CMF basically demonstrates the buying and selling pressure in the market by determining the volume of cash flow. The volume cash flow is denoted as the accumulation and distribution areas of the asset in a specific period of time. By determining the accumulation and the distribution levels of the asset we can have good buying and selling opportunities as well.
But now a question arises how do we determine those levels? The CMF indicator is established on the supposition that the strength of the market can be decided by the closing of the candles in a specific period of time. Let's see how.
When the candle in the market has the closing price nearer to the high point, then it denotes that there is accumulation going on in the market which means that the buyers are in control. When the closing price is nearer to the low, distribution is taking place which means that the selling pressure is high.
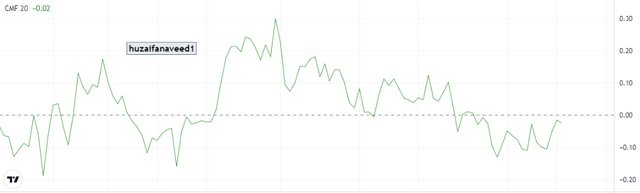
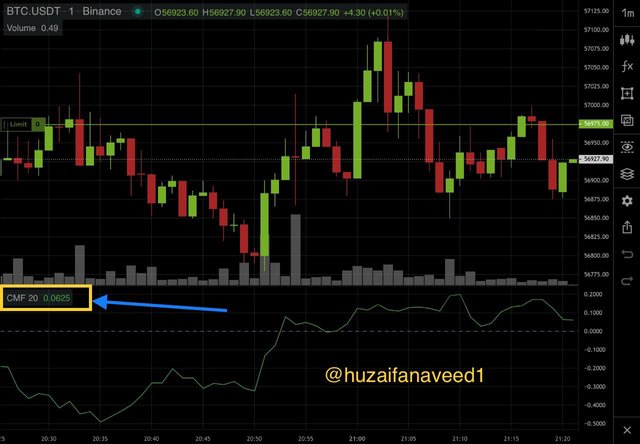
The CMF indicator has only a single line which varies from the values of -1 to 1 with a center neutral value 0 which is also called the midpoint
The CMF indicator denotes an increase in the volume and the buying pressure when it crosses the midpoint towards the 1
The CMF indicator indicates an increased sellers' pressure when it crosses the midpoint and moves closer to the -1
The CMF indicator is also used to determine good buying and selling points in the market, crossovers, bullish and bearish divergences, and Potential trend reversals.
All of these scenarios will be discussed in the upcoming questions.
Calculation of CMF Indicator
In this section, I'll be presenting the formula of calculating the CMF and explain by presenting an example as well
Money flow Multiplier (MFM)
- MFM = [(Close Price - Low price) - (High price - Close Price)] / High price - Low Price
Money Flow Volume (MFV)
- MFV = MFM x Volume for the given period.
Chaikin Money Flow (CMF)
- CMF = Money Flow Volume / Period (20/21) sum of volume.
Example
Consider the values given below:
High: $4070
Low: $2600
Close: $3900
Volume for the given Period: $8,000
Volume for 21 period: $24,000
For MFM
MFM = [($3900 - $2600) - ( $4070 - $3900)] / ($4070 -2600)
- MFM = 0.77
For MFV
- MFV = 0.77 x $8000 = 6149
For CMF
CMF = 6149/24000 = 0.25
From the calculation above derived from the formula the value of CMF is:
CHAIKIN MONEY FLOW = 0.25
If we were to take this example in the practical trading market, It'd mean that the market is at the accumulation level and that the buyers are in a prominent position as the CMF value is 0.25

Q2 Demonstrate how to add the indicator to the chart on a platform other than the tradingview, highlighting how to modify the settings of the period(best setting).(screenshot required)
For this question, I'll be demonstrating the addition and configuration of CMF on [goodcrypto.com(goodcrypto.app) as it is one of the best alternatives of Tradingview.
- Go to goodcrypto and click on Web App

- a new tab will open and on that click on Trade as shown in the screenshot below
- Click on the Fx option on the right and search for Chaikin Money Flow Indicator and click on it
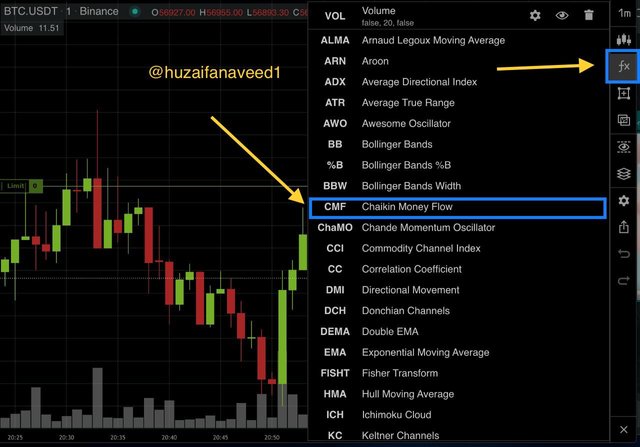
- The CMF indicator will be ready to use on the chart
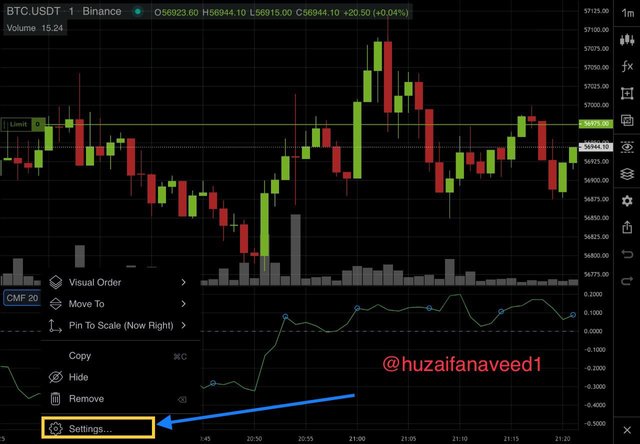
- Click on the indicator and then click on settings for configuration
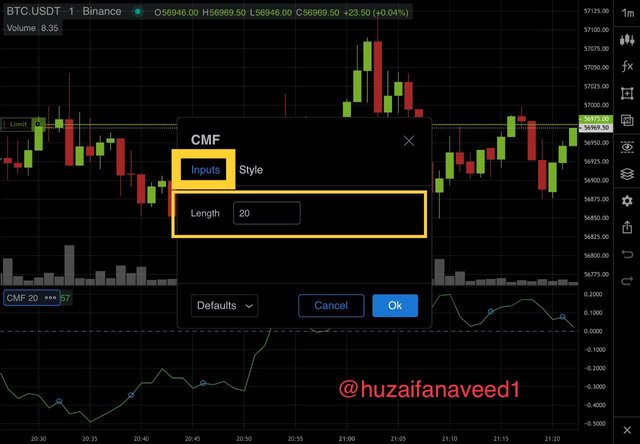
- you can change the period according to your preference. I'll be using the default that is, 20
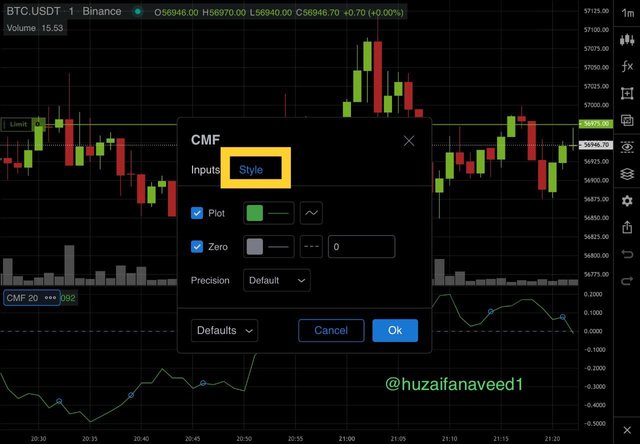
- you can alter the colors in the style option
Best Settings (for me)
Choosing the best settings varies from trader to trader. It's what you're most comfortable with. Whenever you decide to go for a setting in whichever indicator, you are basically deciding how much noise you are ready to face in the market. If you are an intraday trader you'd probably go with low Settings as they tend to give early signals. For Long-term trading, you could use high settings as high settings are sensitive to prominent changes in the assets price.
For the CMF I would head in with the default settings which is 21/20 as it would give me good market entry and exit points. The reason is that the low settings would fluctuate, within very short spans. While higher settings would give fewer entry opportunities due to longer signals. So a mid-range period is best suited to my style.
Q3 What is the indicator’s role in confirming the direction of trend and determining entry and exit points (buy/sell)؟(screenshot required)
The CMF indicator helps us in determining the accumulation and distribution levels of the market through which the buying and selling pressure of the traders for the asset in a specific period of time is determined. When there is high accumulation, it means that the buyers are in a good position in the market, whereas high distribution signifies the control of the sellers.
The CMF indicator helps us in identifying both the bullish and the bearish trend directions. Let's see how
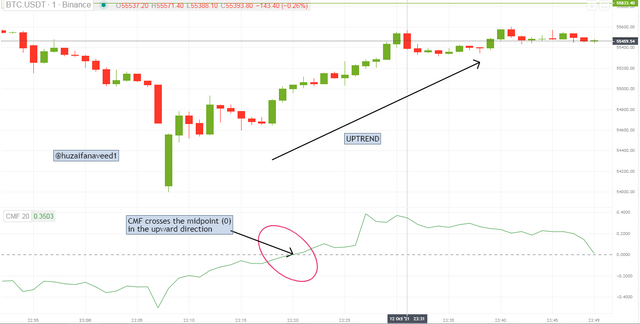
Uptrend
For an Uptrend, the CMF line moves above the midpoint, that is, 0. The movement of the line above the midpoint, towards the positive value, signifies the buying pressure in the market which means that there is higher accumulation.
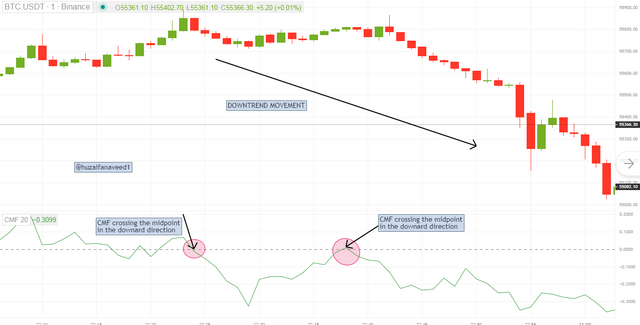
Downtrend
For a downtrend, the CMF line moves below the midpoint, that is, 0. The movement of the line below the midpoint, towards the negative value, signifies the selling pressure in the market which means that there is higher distribution.
Buy Entry and Exit points
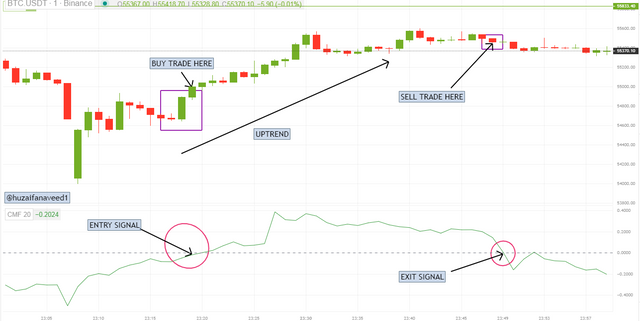
From the demonstration above of BTC/USDT, we get excellent entry and exit points. The entry point was created when the CMF indicator crossed the midpoint in the upward direction, accordingly, we saw the price rising as well. The exit point was conversely presented when the CMF indicator crossed the midpoint in the downward direction.
Sell Entry and Exit points
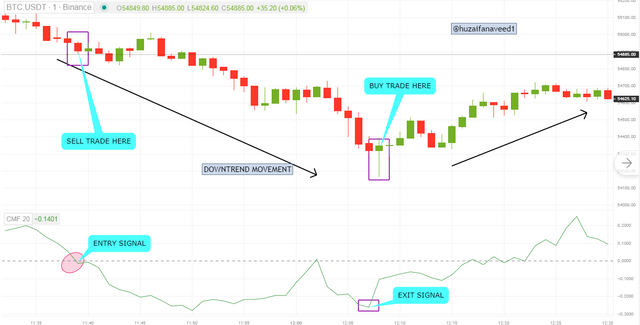
In the above demonstration of BTC/USDT, we get excellent entry and exit points. The entry point was obtained when the CMF indicator crossed the midpoint towards the negative value, with the bearish price movement, giving us an opportunity to capitalize on our sell trade, and the exit point was obtained when the CMF indicator crossed the midpoint again in the upward direction giving us an opportunity for our exit from the trade.
Q4. Trade with a crossover signal between the CMF and wider lines such as +/- 0.1 or +/- 0.15 or it can also be +/- 0.2, identify the most important signals that can be extracted using several examples. (screenshot required)
To have certainty in your trades, a crossover method using the CMF indicator is used by traders which involve crossing of CMF line over the negative and positive +/- 0.1, +/-0.15, +/-0.2 values.
A good buy signal is found when the CMF line crosses over the +0.1 from below whereas a sell signal is generated when the CMF line crosses below the -0.1 mark.
Let me demonstrate to you the crossover signals of CMF using the +/- 0.1 and +/- 0.15
- 1ST CROSSOVER SIGNAL (+/-0.15)
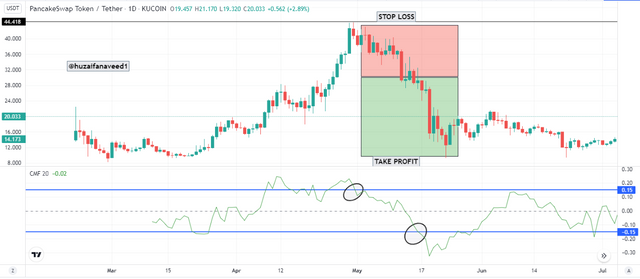
In the demonstration above of CAKE/USDT, we observe that the CMF indicator crossed from the +0.15 level to -0.15 level. Taking advantage of this crossover I placed my sell trade order. A stop loss and take profit level was placed in the ratio R: R 1: 1.5
- 2ND CROSSOVER SIGNAL (+/-0.2)
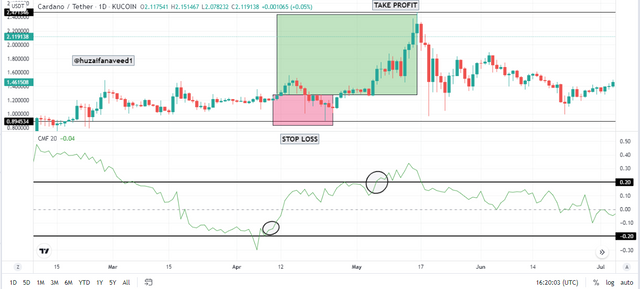
In the above demonstration of ADA/USDTthe CMF indicator gave us an excellent opportunity when it crossed above the +0.2 level with an aligned bullish price movement. A buy trade order was placed with the take profit and stop loss levels intact. The stop loss was placed slightly below the support while The take profit was placed above the candles.
- 3rd CROSSOVER SIGNAL (+/-0.1)
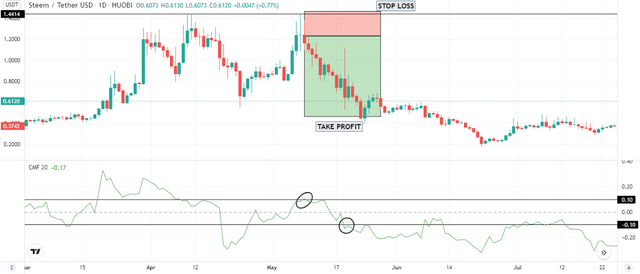
In the above demonstration of STEEM/USDT the CMF indicator gave us an excellent opportunity when it crossed the +0.1 level with an aligned bearish price movement. A sell trade order was placed with the take profit and stop loss levels intact. The stop loss was placed at the resistance while The take profit was placed slightly below the lower candle.
Q5. How to trade with a divergence between the CMF and the price line? Does this trading strategy produce false signals?(screenshot required)
A divergence signal is created when the price of the asset and the CMF indicator does not comply with each other, Which means that the price moves in a different direction while the indicator is in a different direction. This indicates that the buying or selling pressure in the market is diminishing.
Through the CMF indicator, we can get early entry and exit signals through the trend divergence signals which are bullish and bearish divergences respectively. Through the divergence signals, a trader gets an early opportunity to place in his trade.
Bearish Divergence
We notice a bearish divergence when there is weakness in the buyers' pressure in the market. A Bearish Divergence is signified by the downward movement of the indicator while the price rises. This is a good sell signal
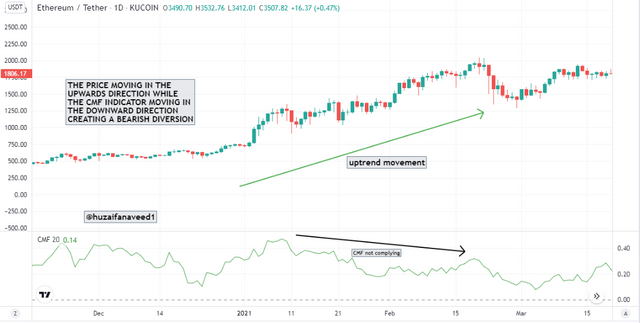
In the demonstration above of ETH/USDT, we can clearly see that the price was showing a bullish movement making higher highs while the CMF indicator moved downwards forming lower lows. This means that the Buyer's pressure in the market is diminishing and we will see a trend reversal.
Bullish Divergence
We notice a bullish divergence when there is weakness in the sellers' pressure in the market. A Bullish Divergence is signified by the upward movement of the indicator while the price falls. This is a good buy signal.
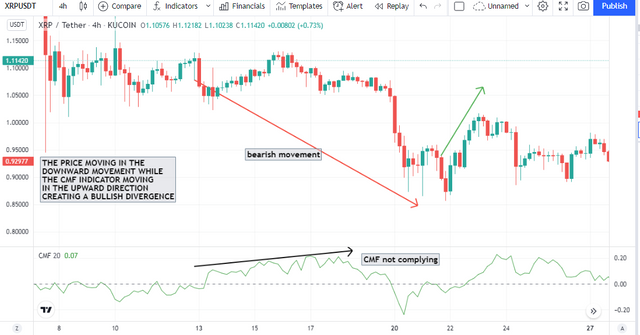
In the demonstration above of XRP/USDT we can see an excellent illustration of price moving in the downward direction making lower lows while the CMF indicator moving in the upward direction making higher highs.
This means that the seller's pressure in the market is diminishing and we will see a trend reversal, which we noticed as we saw the price reversing in the upward direction as the buying pressure imminently increased
False Signals
The CMF indicator can give us false signals just like any other indicator. We can have false early trend reversals signals from the divergences. The best way to stay safe is to use other indicators alongside the CMF indicator such as the Exponential Moving Average Williams %R etc.
The Chaikin Money Flow Indicator is a good addition to my list of indicators which give us signals determining the distribution and accumulation levels of the market. The CMF indicator has positive and negative values. We can get divergence signals from the the CMF indicator through which we can get early trend reversal signals as well
You should use the CMF indicator with other indicators as mentioned above as well to get good trading signals.
Thank you for this informative lecture professor @kouba01. I had an amazing time making this assignment, hope you had a good read as well.
Thank you.
Ps: all screenshots are taken by me from Tradingview.com and goodcrypto.com while the grammar has been checked from Grammarly
Regards,
@huzaifanaveed1

Hello @huzaifanaveed1,
Thank you for participating in the 6th Week Crypto Course in its 4th season and for your efforts to complete the suggested tasks, you deserve a Total|10/10 rating, according to the following scale:
My review :
Excellent work in which all the answers were convincing only as to how to calculate the value of the indicator at a point the total should be adopted Sum of n periods of Money Flow Volume and not the last value of it.
Thanks again for your effort, and we look forward to reading your next work.
Sincerely,@kouba01
Thank you so much professor fo your review. This coming from you means a lott to me.