Crypto season 3 week 4 [homework post for professor @cryptokraze] Dynamic Support and Resistance
In the previous assignments we had learned about what support snd resistance levels are. A support is from where the falling price bounces back up and a Resistance level is from where the price usually stops rising and falls down.
In this assignment we will discuss about the Dynamic Support and Resistance levels.
Dynamic Support and Resistance
The Dynamic Support and Resistance levels differ from the normal Support and Resistance in such a way that usually the Support and Resistance levels are horizontally drawn lines from where the price bounces up or down.
The Dynamic Support and Resistance levels move alongside the price and regulate themselves with the fluctuations in price.
I'll be using Exponential Moving Average (EMA), as instructed by the professor, to demonstrate the support and resistance levels.
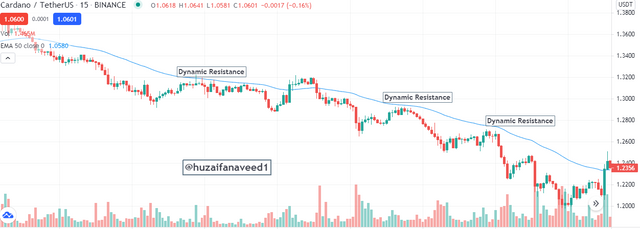
Dynamic Resistance using EMA
In the screenshot below of ADA/USDT we can see the price hitting the dynamic Resistance and then bouncing back.
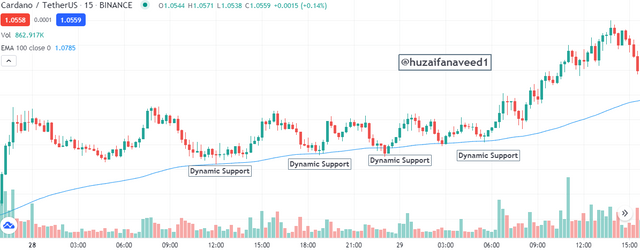
Dynamic Support Using EMA
Similarly in the screenshot below we can see the dynamic support level using the EMA on ADA/USDT chart.
It is quite noticeable that whenever the price hits the EMA line which makes the support level, it bounces back up.

Using 80 and 200 EMA as Dynamic Support and Resistance
For this question I'll be using 80 EMA and 200 EMA as support amd resistance levels. The green line is the 200 EMA and the blue is 80 EMA
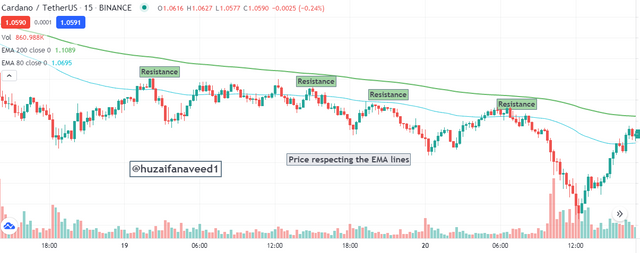
Support Level using 80 and 200 EMA
In this demonstration I'll be using the 80 and 200 EMA for showing the Dynamic Support Level.
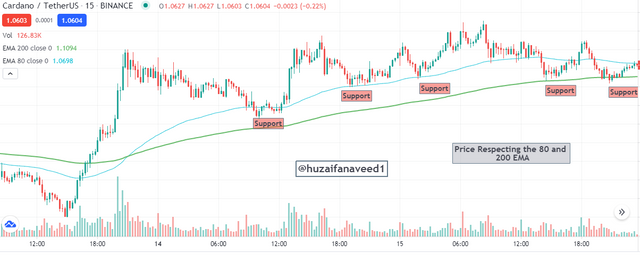
In this chart above of ADA/USDT you can see how the price is respecting the 80 and 200 EMA lines. The price as soon as it hits the EMA line it bounces back up, creating a support level.
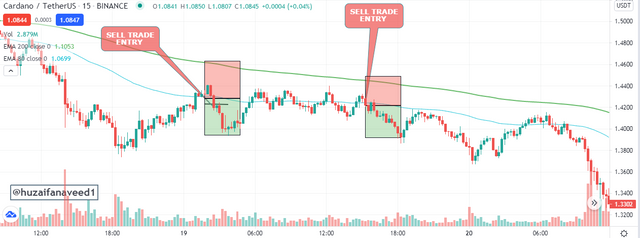
Resistance level using 80 and 200 EMA
Similarly I'll be using the 80 and 200 EMA lines for demonstration of the dynamic support level.
From the above screenshot of ADA/USDT chart we can see that price is rejected at both 80 and 200 EMA and it goes back down.
I'll be explaining entry criteria for both buying and selling.
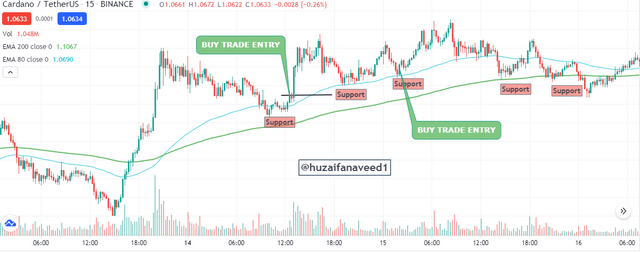
Criteria for Buying Position.
- There should be two Exponential Moving Average. I used 80 and 200 EMA. You can use lower EMAs as well
- see if the trend is bullish. Wait for the price to touch or cross the 80 EMA. This is not a buy a signal as the price could penetrate both the EMAs.
- The price of the asset should be above both the EMAs
- after the price has bounced back after touching the 80 EMA.
- when the price has moved above the 80 EMA. You can place your Buy trade.
Note: using this strategy we can get several opportunities of entering the market in the trend. As we can see in the charts that there are more than one opportunity of entering the market
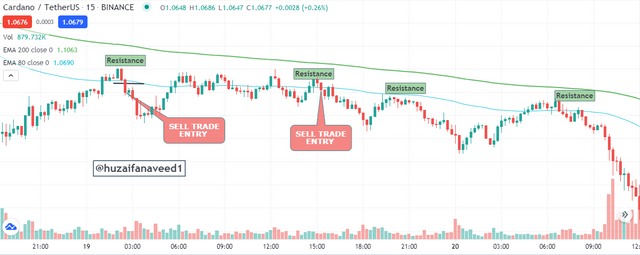
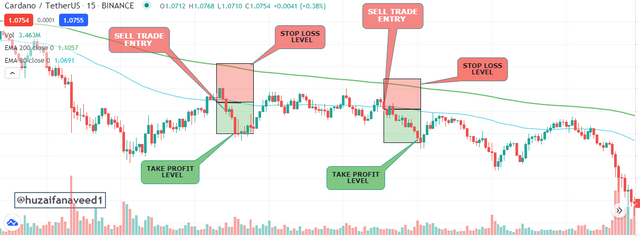
Entry Criteria For Sell Position
- You should have two Exponential Moving Averages. I have used to 80 EMA and 200 EMA. You can use lower EMAs as well.
- Make sure that the price is below both the EMAs for a sell trade entry.
- wait for the price to hit the 80 EMA. This is not a sell trade sihnal as the price could penetrate both the EMAs and move in upward direction.
- look for a clear bearish trend.
- Once the price has hit the 80 EMA line and move back down and just below it you can place your sell trade signal.
Exit criteria for a buy position
- The first thing we do in exiting in a Buy position, is set a Stop Loss as we have learned in previous assignments as well
- the stop loss is set below the 200 EMA.
- The setup would be cancelled if the price crosses the stop loss level.
- You should set up a take progit level with a 1:1 RR (Risk:Reward)
- when the price reaches the take profit level set up by you, you can exit the market with good profits.
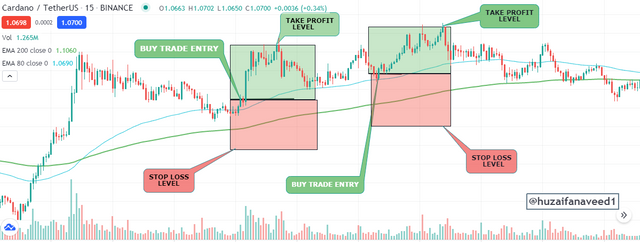
Exit Criteria For Sell Position
- similarly exiting in a sell position you should set a stop loss as well
- the stop loss should be above the 200 EMA
- if the price breaks through the stop loss level, the set up is cancelled and you should wait for another set up
- Take Profit level is also set up
- The take Profit level should be 1:1 RR(Risk:Reward) which means the Profit is equal to the stop loss.
- when you see the price hitting the take profit level you should exit the market
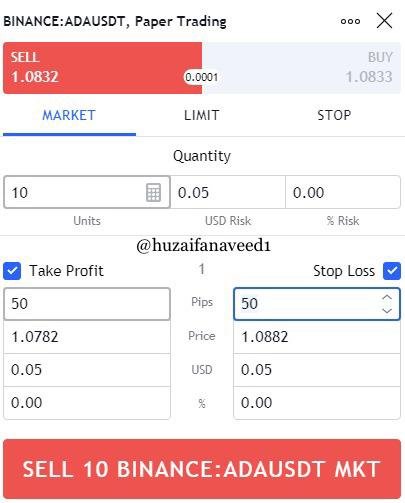
In this question I'll be carrying out two demo trades using the Dynamic Support and Resistance levels on my Tradingview.com account
a) ADA/USDT on 15 Minutes Time-frame
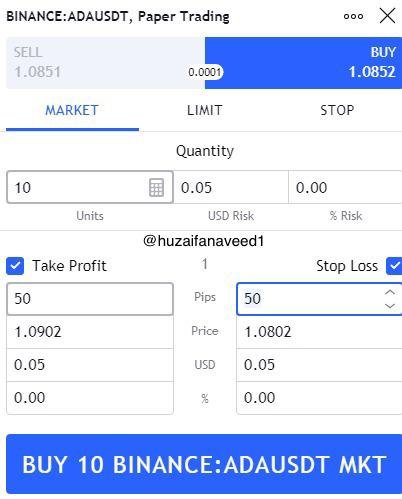
On the ADA/USDT demo trade that I will demonstrate we can see that the price hit the 80 EMA line and then retested. When I noticed the price against the 80 EMA I placed my sell order.
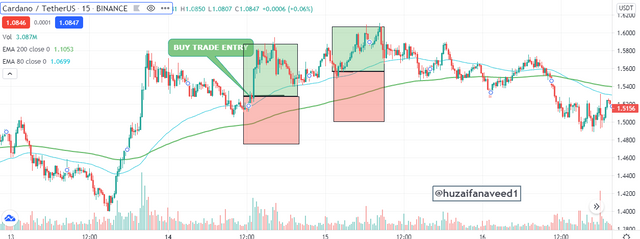
b) Second Demonstration
In this demo trade we had the perfect buying opportunities using the 80 and 200 EMAs. The price was moving above the 80 EMA. As soon as I saw the price hitting the 80 EMA and then retesting, above the bullish candle i place my buy trade.
In the above demo trades we learned that whenever placing a buy or sell order we have to take the EMAs into consideration for the dynamic support and resistance levels.
So this assignment comes to an end. Indeed another amazing strategy for intra day trading which can come in very handy if you use this strategy correctly.
The dynamic support and resistance levels were infact new for you. Thank you professor @crytpokraze for this lecture.
Lastly in this lecture we learned about the Dynamic Support and Resistance Levels. The use of EMAs for these levels. You can use lower EMAs for the dynamic support and resistance levels as well. With this strategy we learned our exit and entry strategies. And alsoI demonstrated this strategy on two demo trades.
I enjoyed making this assignment. Hope you had a good read as well. Wondering which strategy would we learn next.
NOTE: all screenshots were taken from my tradingview account
Regards
@huzaifanaveed1

Dear @huzaifanaveed1
Thank you for participating in Steemit Crypto Academy Season 03 and making efforts to complete the homework task. You got 10/10 Grade Points according to the following Scale;
Key Notes:
*.You have shown good understanding of the strategy by making precise charts for different elements of the strategy.
We appreciate your efforts in Crypto academy and look forward for your next homework tasks.
Regards
@cryptokraze
Thank you so much for your review and your guidance.