Crypto Academy - Season 3 - Week 1 - [Homework Post for @kouba01] by @huzaifanaveed1
Standing in the middle of a chaos, unable to move, observing how everything and everyone is in motion, moving towards their goal so effortlessly. How everybody has a place to be or a path to follow but you just stand there noticing how clueless you are because you don’t know where to go or what to follow.
That happens when you do not have a direction, you do not have a guide, something or someone who would indicate you your path.
This is an actual depiction of the Cryptomarket. You'll always find yourself lost if you jump in the market without the essential technical indicators and the knowledge to interpret them. Your rate of success in the market is directly proportional to your analytical skills of the indicators and the analysis of the market.
In this first week of the new cryptoacademy season Peofessor @kouba01 stressed upon one of the most important technical indicators; Ichimoku-kinko-hyo Indicator
The name of this Indicator, difficult as it may seem, is very important. Questions arise what is Ichimoku-kinko-hyo Indicator, how do we apply it and how does it benefit us in the market?
To get your answers follow this post
QUESTION 1
Developed by a Japanese journalist, Goichi Hosado, the Ichimoku-kinko-hyo Indicator was released in the late 1960s after a working of 30 years of his life. It was not untill 1990s that it gained popularity in the Europe as well.
The motto behind Ichimoku-kinko-hyo was to get hold of the market by just having a single look on it and the word ichimoku literally translates to one glance. Which means we can determine the momentum, support and resistance levels through this indicator. We can also do future prediction of the market through this indicator.
The Ichimoku-kinko-hyo consists of five lives. Lets discuss them in detail.
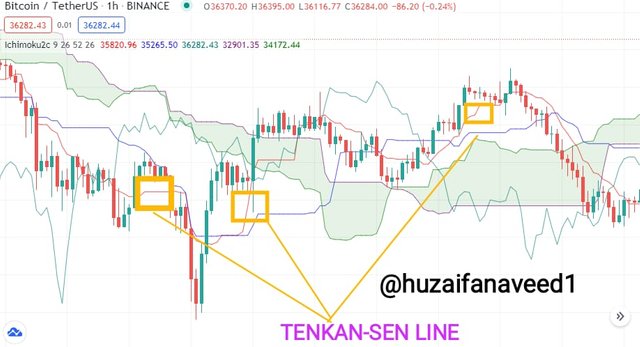
a) Tenkan-Sen(Conversion line)
The Tenkan-Sen line can be calculated by adding the maximum low and the maximum high in the market over the
Last 9 periods and then dividing the value by 2. This will show the mean price over the past 9 periods. The Tenkan-Sen line represents the resistance level, reversal points and the support.
- Tenkan-Sen = Past 9 periods(Highest price + lowest price/2)
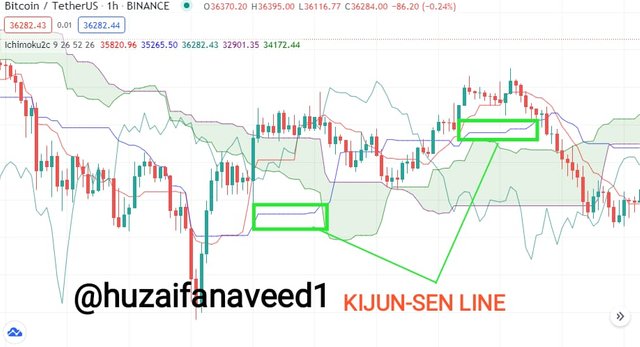
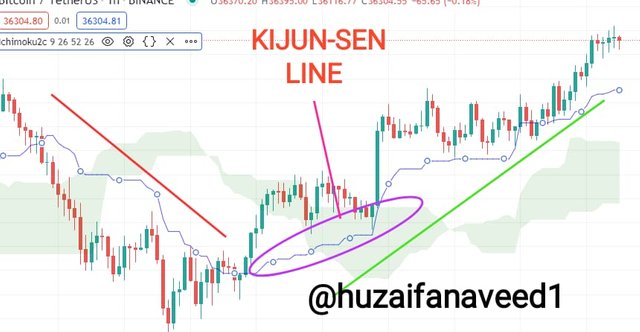
b) Kijun-Sen(Base Line)
The Kijun-Sen line, similarly like the Tenkan-Sen line is calculated by taking the highest price point plus the lowest price divided by 2. The difference is that it is taken over a period of 26.
The Kijun-Sen line indicates the trend movements. When the market is above the Kijun-Sen line it is an upward trend. And when the market is below the Kijun-Sen line, it's a downward trend.
As it is used for longer period of time, we can determine medium level trends using this line.
- Kijun-Sen = past 26 periods(highest price + lowest price/2)
c) Senkou span A
The Senkou span A or the leading span A is devised with the help of the Tenkan-Sen line and the Kijun-Sen line
The Tenkan-Sen and the Kijun-Sen lines are added and then divided by 2 and arranged in a 26 in the future.
The Senkou span A used alongside Senkou span B can predict potential areas of resistance.
- Senkou span A = period of 26(Tenkan-Sen + Kijun-Sen/2)
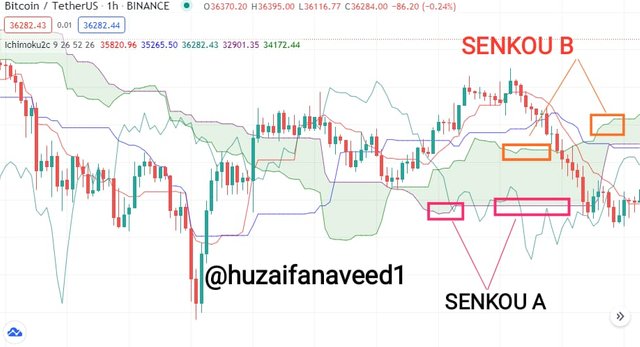
d) Senkou span B
The Senkou span B or the leading span B is used to identify the future areas of support and resistance. The Senkou span B is calculated by adding the highest and the lowest price in the period of 52 divided by 2.
- Senkou span B = Period of 52(Highest price + lowest price/2)
The area within the Senkou span A and Senkou span B is known as the Kumo in Japanese or simply as the cloud. This area represents the support and the resistance levels. If the market is above the 'cloud' it indicates the support level. If the market is below the cloud, it indicates the resistance level.
e) Chikou Span:
The Chikou Span or the lagging span is used to identify the potential support and resistance levels. This is the 5th and last line of the Ichimoku-kinko-hyo. The Chikou Span is projected in a period of 26 after the recent price has closed. Due to this we can have a relation between the last and the current market trend.
If the Chikou Span is above the market, it indicates an upward trend, and if it's below the market, it indicates a downward trend.
The Ichimoku-kinko-hyo, its use, and its details were thoroughly discussed along sided the 5 lines and their calculations. Hope it's clear to you all

QUESTION 2
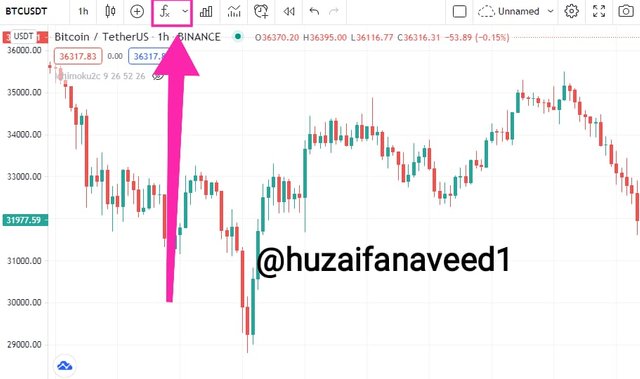
In this question I will demonstrating how to set up the Ichimoku-kinko-hyo Indicator on tradingview.
a) on the main trading screen click on the indicators option as shown in the screenshot below.
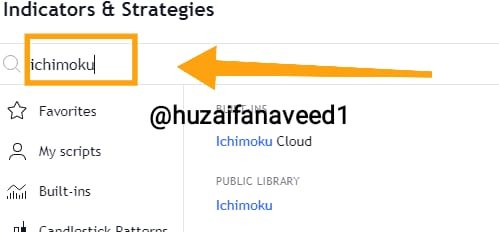
b) search for Ichimoku-kinko-hyo Indicator as shown in the screenshot below
c) click on the setting options of the indicator as shown in the screenshot below.
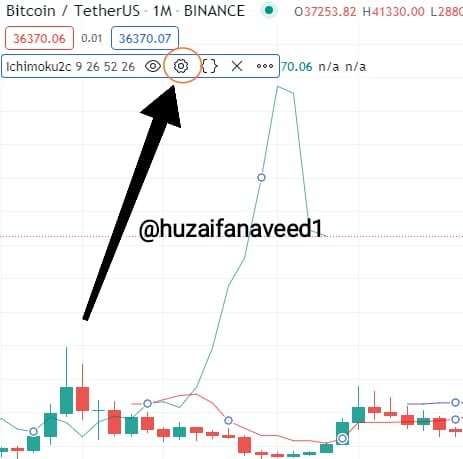
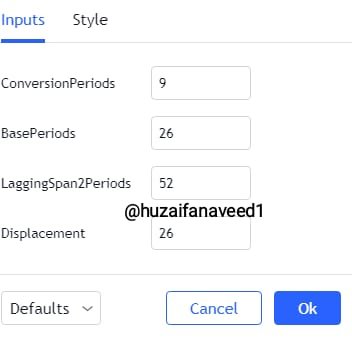
d) check the input carefully and put the periods right.
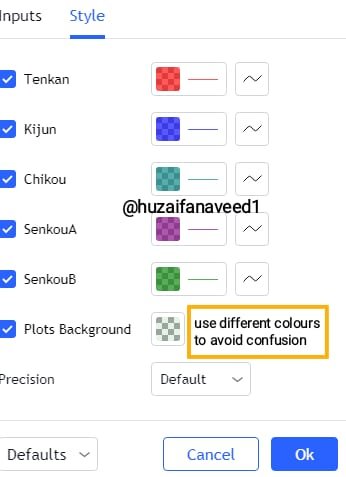
e) use different colors for lines to avoid confusion as shown in the screenshot below.
The Ichimoku-kinko-hyo indicator is all set to use
I would advise to go with the period of for the Tenkan-Sen, period of 26 for Kijun-Sen and Senkou span A and period of 52 for Senkou span B for better results.
Also as I have stated this in my previous posts as well. Never rely on a single indicator all together. Use more than one indicators so that you get maximum precise results. I will demonstrate this in the coming questions
Setting up the Ichimoku-kinko-hyo Indicator was thoroughly discussed with screenshots. Hope it's clear to you all
QUESTION 3
Tenkan-Sen line:
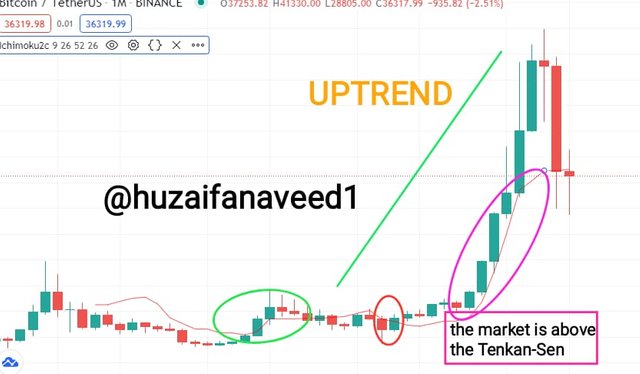
As mentioned above by me, the Tenkan-Sen line is used for short period of time. The prediction done through the Tenkan-Sen line is over the period of 9. When the market trend is above the Tenkan-Sen line, it is considered as an uptrend and when the market is below the Tenkan-Sen line, it is considered as an downtrend but note the most important thing, ie, Tenkan-Sen line is used only for short-term
Kijun-Sen line:
The Kijun-Sen line predicts the movement of the market trend over a medium-term. Its used over the period of 26. We usually use the Kijun-Sen line alongside the Tenkan-Sen line to get more peculiarities.
In this question I will be demonstrating how to use the Kijun-Sen line alongside Tenkan-Sen line.
Tenkan-Sen and Kijun-Sen simultaneously:
As mentioned above the Tenkan-Sen is for short-term and the Kijun-Sen is for medium-term. So using both these lines together will give a better result.
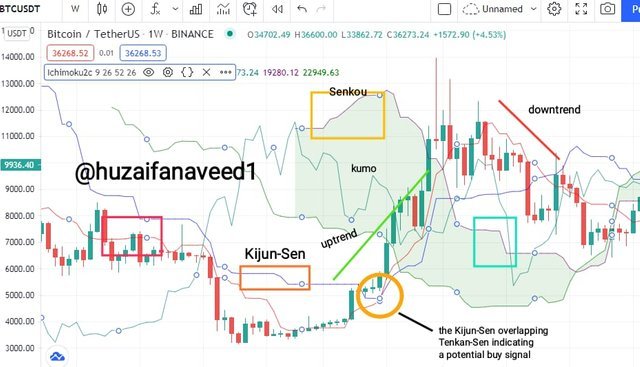
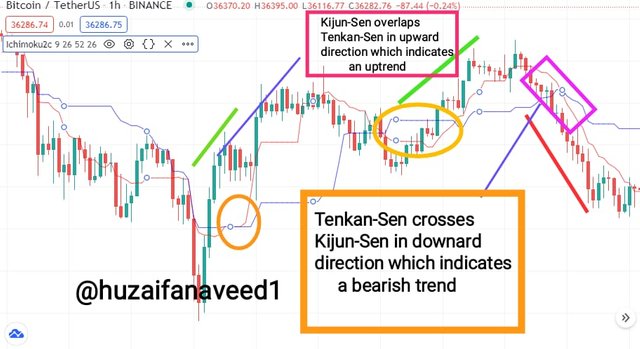
- when the Kijun-Sen line overlaps the Tenkan-Sen line in the upward direction it is an uptrend indication of the market.
- when Tenkan-Sen line overlaps the Kijun-Sen line in the downward direction it is a downtrend indication of the market
- both the Tenkan-Sen and the Kijun-Sen lines give off the edges of the kumo which gives of the signalling of the future resistance and support points.
Using the Tenkan-Sen and the Kijun-Sen lines simultaneously was discussed thoroughly and hope its clear to you all
QUESTION 4
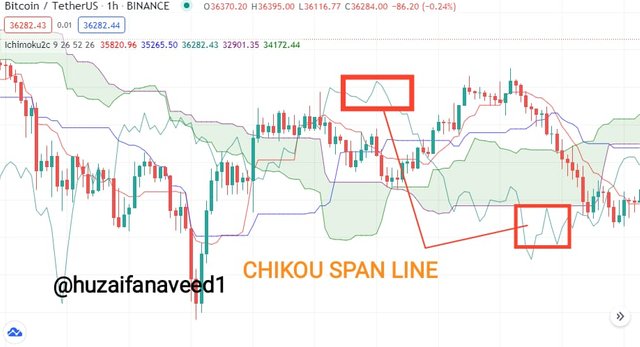
The Chikou Span line
The Chikou Span line being one of the most vital lines which come in handy while tracking the relation between the current market and the previous market trends. It is projected in the period of 26 after the previous market closure.
Using a Chikou Span line
The Chikou Span line is a vital part of the ichimoku indicator. It gives us the indication of the relation of the past trend and the current trend which will help us in specifying the possible trend reversals. Furthermore the Chikou span line helps us in indicating the nature of the market, whether its bullish or bearish. When the Chikou Span line overlaps the price it indicates a bullish trend in which a trader will have opportunities to make profits and when the Chikou Span line crosses the market in the downward direction it indicates a bearish trend which indicates a sell signal for the trader.
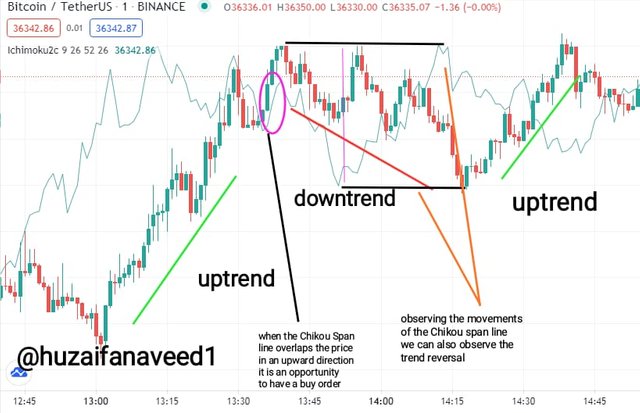
In this screenshot above we can see the signals the Chikou Span line gives us. The uptrend and the downtrend movements are marked in which if the trader plays safely he can pull out with good profits
Why is it Neglected?
The Chikou span line although one of the most important, is oftenly ignored by some traders due to some reasons which are listed below.
- Sometimes when the Chikou Span line overlaps the asset's price in upward and downward direction simultaneously, it is ignored as there are no obvious sign of any trend.
- The Chikou Span line calculates the price of the previous trend over a period of 26 in a relation with the current trend which gives no future prediction of the market trend
- The other lines of the Ichimoku indicator when used together give off better results, such as the kumo which gives off the future resistance and support levels. So Chikou is oftenly ignored.
The Chikou span line was thoroughly discussed and method using it with an example. The reason of neglecting it was also discussed, though I believe we shouldn't ignore the Chikou Span line as it is an important component. Hope its clear to you all
Question 5
Best time-frame to use the Ichimoku-kinko-hyo Indicator
The Ichimoku indicator could be used with any time-frame. It basically depends upon the nature of the trader.
If you like short-term trading you could use this indicator with short time frames such as minutes and hours. If you're flexible in long-term trading you could opt for the weekly or a 15-day time frame.
Below I will share with you an example of the Ichimoku indicator used in a weekly time frame

Best Indicator to use with Ichimoku
I've mentioned this in my previous assignment posts as well and will mention it here too, that it is always advisable to use multiple indicators at a time to get better results.
Although the Ichimoku indicator is an independent indicator itself which all by itself helps us in indicating the support and resistance levels, we can also predict the market trend using this indicator, and also compare the current market trend with the previous.
But for precision I will be using the Relative Strength Index(RSI) and the Moving average convergance divergence (MACD) indicator to be absolutely sure of the market before trading.
Lets have a look on Ichimoku indicator with the RSI
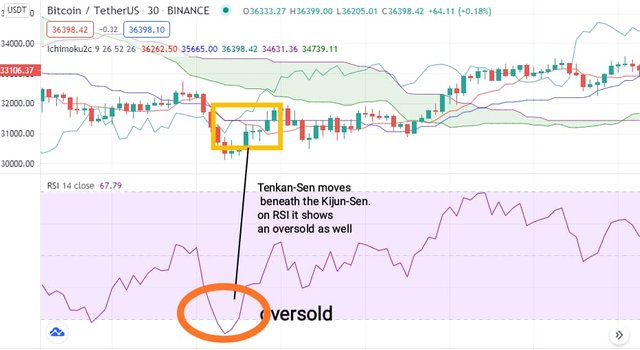
in this screenshot you can as I have marked that when the Tenkan-Sen line overlapped the Kijun-Sen line in the downward direction, the RSI also indicates an oversold position as the line moves towards the 30 direction.
Ichimoku indicator with MACD
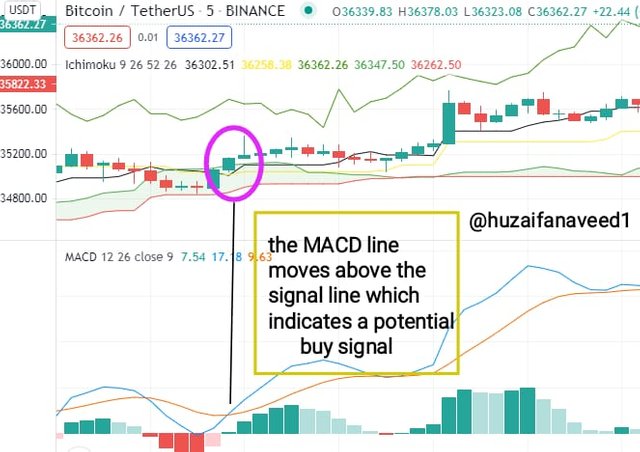
In this above screenshot I have used the Ichimoku indicator with the MACD.
In this above screenshot as I have marked you can clearly see when the Tenkan-Sen line crosses the Kijun-Sen line in the upward direction, the MACD also indicates the MACD line moving above the signal line which indicates a potential buy signal.
So as demonstrated above, you can use different indicators alongside the Ichimoku according to your feasibility. I would rather choose the RSI over the MACD as MACD sometimes gives off false signals as well
The time-frames as well as indicators were thoroughly discussed.
Finally this lengthy topic comes to and end. This assignment took me quite some time time in composing but I enjoyed every minute of it as I learned another new indicator today.
First of all a big thanks to the Japanese journalist Goichi Hosado, who came up with this amazing indicator which has helped traders alot.
Secondly to professor @kouba01 for coming up again with an amazing indicator in this new season's first post. I hope the continuation of the indicators remains throughout this season as well, because it is very informative for me as well as other students as well.
Lastly, in this assignment post we learned about the basics of the Ichimoku-kinko-hyo Indicator and the lines associated with it. We learned how to set up this Indicator on the chart and how to configure it. Then we discussed in detail about the Tenkan-Sen line and the Kijun-Sen line and also how to use them simultaneously. After that we shed light on the importance of the Chikou Span line and the reasons why it is oftenly ignored. After that we learned about using the Ichimoku indicator with different time-frames and different Indicators such as the RSI and the MACD with real chart examples.
I enjoyed making this post, and hope everyone reading this had a good read as well.
Regards,
@huzaifanaveed1

Hello @huzaifanaveed1,
Thank you for participating in the 1st Week Crypto Course in its third season and for your efforts to complete the suggested tasks, you deserve an 8.5/10 rating, according to the following scale:
My review :
A good article that contains correct answers, albeit a little short in explanation, but this does not prevent me from greeting you for your clear methodology and careful analysis of the points raised.
Thanks again for your effort, and we look forward to reading your next work.
Sincerely,@kouba01
Thank you professor @kouba01 for your reviews. I will try my level best to be better in my next tasks.
thank you