Crypto Academy | Season 3 | Week 4 [Homework Post for Professor @asaj] Commodity Channel Index

You cannot send out an 'SOS' signal to the control center as you don't have the tools of doing so. It was foolish of you to embark on this voyage without the necessary maps and tools.
Same applies to the Cryptomarket. You cannot jump into the market without having the appropriate indicators and the knowledge to interpret them. Your success in the market is directly proportional to your analytical skills of the indicators and the analysis of the market.
This week Professor @asaj emphasized on one of the most important indicators; Commodity Channel Index
Now what is CCI, how do we apply it and how do we use it to our advantage?
All of this will be conveyed in this post.

The CCI is a technical indicator which is categorised in the oscillators. It calculates the price of any crypto asset in the market at the rate at which its price changes. It helps us identifying the overbought and oversold levels.
There are three important levels of the CCI which are;
- The High level (above +100%)
- The central level
- The low level (below -100%)
The High Level
When the price of the asset is more than that of its historical average, the CCI gives us a reading of above 100% point. This indicates an overbought condition.
The Central Point
When the current price of the asset is equal to it's historical average, the CCI gives off a zero reading. This might mean that there are equal number of buyers and sellers in the market at that moment
The Low level
When the price of the asset is lesser than it's historical average, the CCI gives off a reading below -100% point. This indicates an oversold position.
1
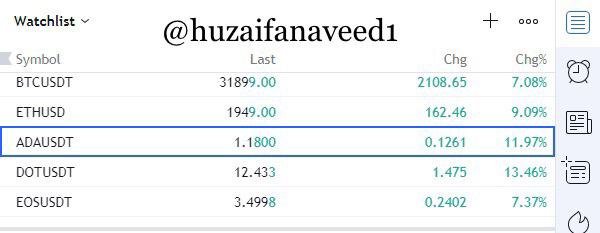
Open a demo account on any trading broker and select five cryptocurrency pairs
The first question of this assignment is to open a demo account on any trading broker snd select five Cryptocurrencies pair.
I chose the Tradingviev.com as I feel the most comfortable trading on it.
Here's my account screenshot

Here are the 5 Cryptocurrency pairs
BTC/USDT
ETH/USDT
ADA/USDT
DOT/USDT
EOS/USDT
2
Create a market entry and exit strategy
Exit and Entry Strategy Using The CCI
whenever entering or exiting the market we have to make sure of certain things. Atleast I make sure of some things. Everybody has a different trading style and different strategies.
Whenever Entering the market I look gor the trend. I check whether the market is in a bullish trend or a bearish trend.
Secondly I always take help of the indicators. Some of my favourite indicators are RSI, EMA and MACD. In this lecture I'll be using the CCI
Setting up a stop loss and a take profit. A stop loss level helps you in such conditions if the market trend doesn't go in your desirable direction. If the price of the asset touches the stop loss level, the setup gets invalidated and I start looking for another set up.
I set a take profit level at atleast 1:1 Risk:Reward ratio.
Below I'll be demonstrating my buy and sell signals on a ADA/USDT chart using the CCI*
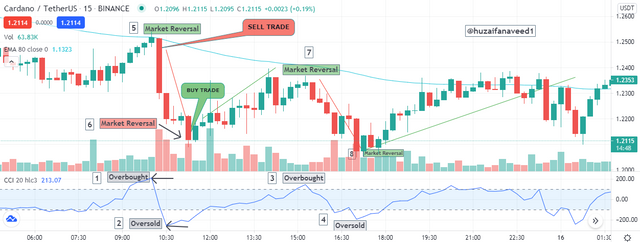
Sell Trade
In the demonstration above we can see that at position 1, we notice an overbought condition, through which at position 5 we notice a trend reversal. When you observe a CCI giving off an overbought condition it is a good time to sell your asset as it will result in a trend reversal.
Similarly at position 3 we again see the CCI abover +100% giving off an overbought condition. At point number 7 we see another trend reversal. So it's a good time to sell your asset.
Buy Trade
In the screenshot above we notice at point 2 the CCI indicator gives us a clear oversold condition as the CCI is below the -100% mark. When we see the market corresponding with the point 2, we observe a trend reversal at point 6, which marks us a good signal fir a buy Entry.
Similarly at point 4 we see yet another oversold condition and the market corresponds with it as at point 8 we notice a trend reversal. This, again, is a good signal for a buy entry.
for a better corresponding and understanding I used the CCI and Moving Average Covergance Divergence (MACD) indicator alongside.
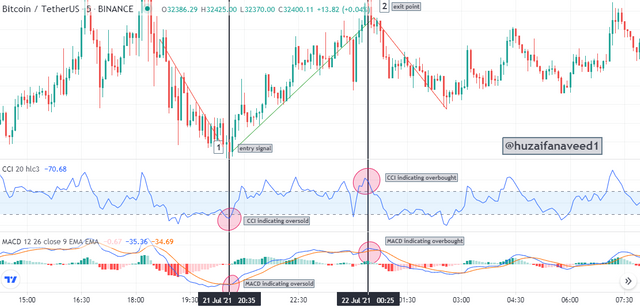
In this demostration I used the CCI and the MACD indicator together.
if you observe the point number 1, on CC1 there is a -100% indication and the MACD corresponds to it. This gives us an oversold condition and a good Entry Point
Now immediately after point 1 we see a trend reversal and at point 2 we observe CCI giving us a +100% indication and the MACD corresponds to it. This leaves us in a overbought condition and a good exit point
Point to Remember: Sometimes the CCI doesn't cross the ±100% lines, but it touches these lines and bounce back up/down. When the line touches the the ±100% it still is a buy/signal for the trader.
3
Use the signals of the Commodity Channel Index (CCI) to buy and sell the coins you have selected
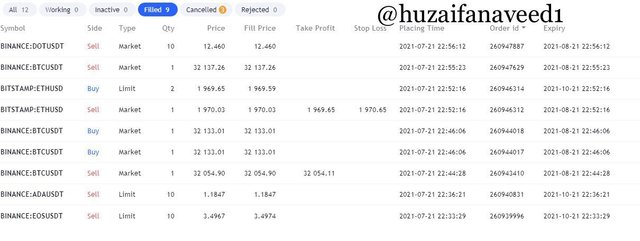
I'll be demonstrating demo trades on all the 5 assets I chose. I've also placed multiple orders on some of the assets for my better understanding.
a) DOT/USDT
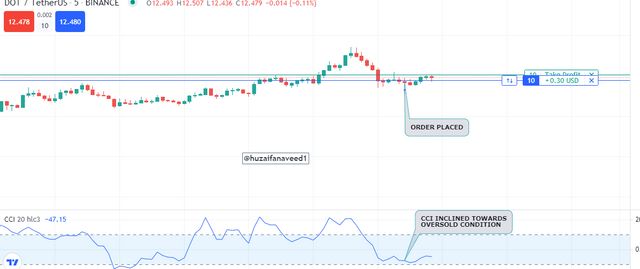
I saw the commodity channel index inclined towards the oversold condition.
I executed the trade at the point I marked.
b) BTC/USDT
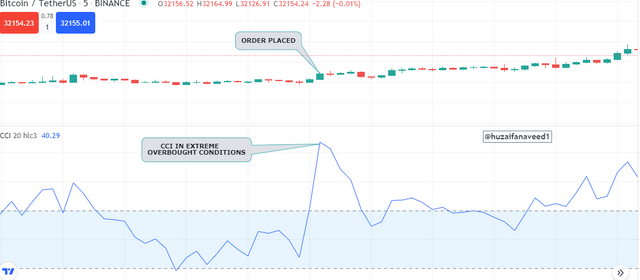
I observed the Commodity Channel Index indicating the overbought condition. It was way above the +100% and placed my trade.
One thing to notice that the CCI is showing a reversal aftet the overbought conditions but if you notice the market, there is no as such trend reversal.
c) ETH/USDT
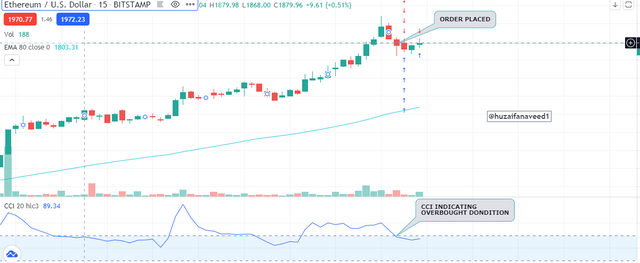
I observed the overbought condition through the Commodity Channel Index, but the indicator was showing a slight down way movement. I placed my trade there.
d) ADA/USDT
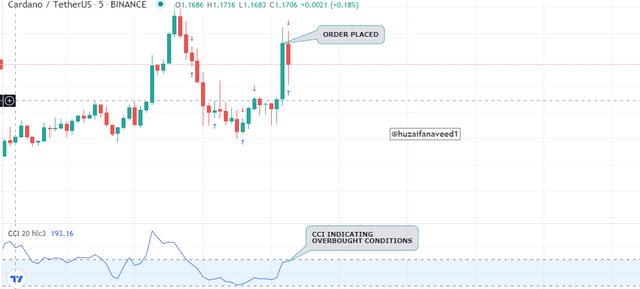
In this demo trade, I observed CCI indicating an overbought condition and it was touching the +100% line.
I placed my trade there
e) EOS/USDT
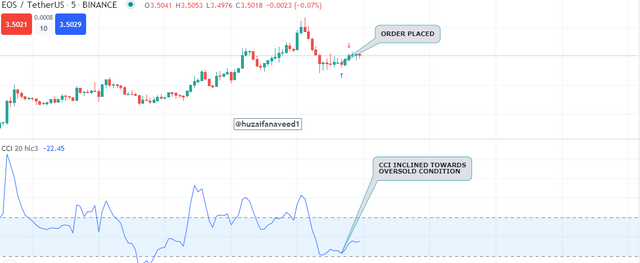
The Commodity Channel Index was indicating a movement near the oversold conditions and after that it was moving upwards, indicating a trend reversal which was in confluence of the market. I placed my trade.
Below is the screenshots of all the trades.
I placed multiple trades on a couple of assets
4
Declare your profit or loss
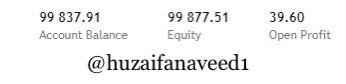
I was able to get a profit of $39.60 from all my trades. Though I also got a bit loss in 2 of my trades but overall I received a profit of $39.60
I started trading with an amount of $99,837.91 and after the profit of $39.60 I had a Equity of $99,877.51
5
Explain your trade management technique
Implementation
This is a important point to acknowledge that your trade will exactly be how you manage your trade. You'll need to place stop loses and take profits.
I placed the stoploss and take profits level which I usually place in a 1:2 RR or 1:3 RR.
Trade Reversals
One thing we learned from the CCI is to handle a trade reversal. Other than the CCI you can use multiple EMAs for identifying a trade reversal. You can, with the help of the CCI identify a trade reversal. When the CCI is indicating an overbought condition, you should sell your asset as the market will most probably show a trend reversal in a downward direction. When the CCI indicates an oversold condition, buy the asset, as the trend will bounce back up.
Set Targets
I read this somewhere ages ago that for better trade management you need to set targets. Set small targets in the beginning. You don't necessarily need to have big profits in the beginning. You can divide your targets into three stages.
a) a small target, which should be close to your entry point
b) you real target which should be atleast 1:2 RR. Which means that your reward should be twice the risk
c) a big target for a big win. You could place your target way above than your entry point.
Greed and Psychology
Yes, one of the most important things while trading is your psychology and your greed. I never fall into the trap of greed. As a saying goes;
There is no calamity greater than lavish desires. There is no greater guilt than discontentment And there is no greater disaster than greed.
So I don't burden myself with excessive trades. Also a very common term in the trading world, the FOMO aka Fear of missing out. It is a condition in which traders normally get afraid of missing out on big profit oppurtunities. I used to succumb to FOMO and it taught me good lessons. So now I have my trade management of not getting more than 10 trades in a day. No matter how much I'm craving for it, I avoid what my heart is saying and listen to my brain. So this is very important for me to not give in to FOMO and greed.
Another thing for the trade management that I have observed is that sometimes CCI does give out false signals as We've seen in the example of BTC/USDT given above by me. So in these cases it is advisable to use other indicators as well, such as the Relative Strength Index.
But nonetheless the CCI helps in identifying the trend reversals, as shown in the examples above.
The commodity channel index is an important indicator for identifying trend reversals. We can use multiple EMAs as Dynamic Support and Resistance levels as well to help us identify the trend reversals.
This was an interesting topic in which we learned about the CCI. Then we shed light on our exit snd entry strategies using the CCI. Furthermore, 5 crypto pairs were chosen and I executed demo trades on them individually with sharing the profit/loss I had in those trades.
I had a good time making this assignment task professor @asaj
Hope you have a good read as well
Regards,
@huzaifanaveed1

Hi @huzaifanaveed1, thanks for performing the above task in the fourth week of Steemit Crypto Academy Season 3. The time and effort put into this work is appreciated. Hence, you have scored 6.5 out of 10. Here are the details:
Remarks:
First and foremost, this was a pleasant read. You wrote according to your understanding, which is what we encourage in the academy. And your work looks original, although you paraphrased some sentences from my post on the topic.
That aside, it would have been nice to see you confirm or reject the signals of CCI using other indicators. Also, take a second look at the screenshot and explanation
This explanation is unclear and leaves readers with some questions, such as: what kind of order did you place? Was it a buy or sell order? This applies to most charts you uploaded.
Apart from that, you have made a good attempt to demonstrate your understanding of the topic. We hope to see more from you in the coming weeks.
Hey professor @asaj thank you for reviewing my post.
I've always looked up to you in this crypto academy as I love reading your works. So, ye, I did try to absorb your style but not much.
Secondly I edited my post before you had checked it, adding the MACD indicator on my demonstration. I dont know how it didn't show up when you were checking my assignment. Even now if you go through my assignment you'll see the MACD indicator example in question number 2
This example wasn't there in the original post, I edited it afterwards.
Thirdly thank you for pointing out my unclear trade executions. I'll try my best to not make these silly mistakes in my upcoming tasks.
Have a good day professor.