Crypto Academy | Season 3 | Week 2 - [Homework Post for professor @yohan2on]
Hello everyone. A warm greeting to professor @yohan2on and everyone reading this.
It feels good writing the assignment post for professor once again in this new season.
In this assignment post, we'll learn all about Fibonacci Retracement Levels, its practical understanding, how to use it and much more.
Lets get started
The Fibonacci Retracements were invented by a a mathematician Leonardo Fibonacci in the 13th century. 7 centuries later, it's still useful for the traders.
- What is Fibonacci Retracement Level?
The Fibonacci Retracement Levels are simply horizontal lines which work the best in a trending market, ie, an uptrend or a downtrend. These lines can be drawn between any highs or lows. The Fibonacci Retracement Levels help us in indicating the Support and Resistance levels.
The Fibonacci Retracement Levels are linked to the Fibonacci numbers and with a percentage. The percentages of the levels are; 23.6%, 38.2%, 61.8%, 78.6% and 50%. The 50% is usually not considered a part of the retracement levels as it is not devised out of the Fibonacci Sequence
Fibonacci sequence
The Fibonacci sequence numbers consist of 0,1,1,2,3,5,8,13,21,34,55,89,144 and so on. One might wonder how are the Fibonacci sequence numbers derived? The numbers are derived by adding up the previous two numbers
Example; 0+0= 0, 0+1= 1, 1+1= 2, 2+1= 3 and so on

The ultimate goal of using a Fibonacci Retracement Levels in a market is know where the market is trending and where it is retracing.
As mentioned above it is used in a trending market. The market could either be in an uptrend or a downtrend. I'd demonstrate in both the markets.
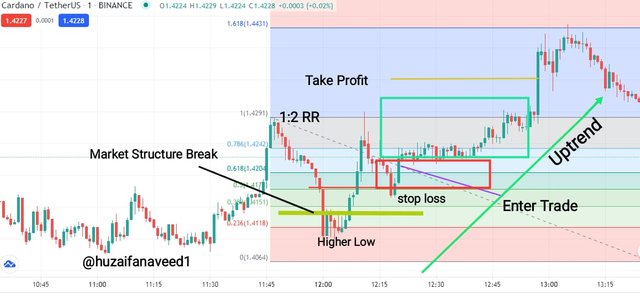
Uptrend Market
In an uptrend market, the Fibonacci Retracement Levels are used to measure the retracement or the temporary shift in the market. These retracements are usually temporary as the market is moving in upward direction, and a good point for buying trades.
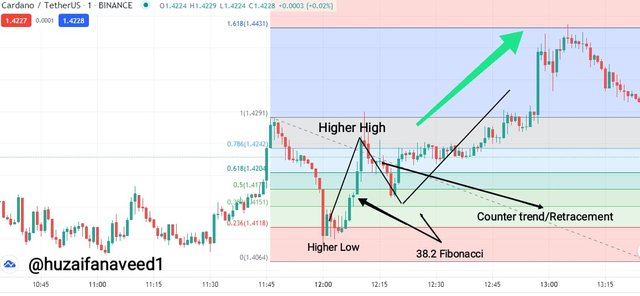
After a series of Higher Highs we notice a Retracement which forms a lower High, which indicates a good buying position in an uptrend market
Downtrend Market
In a downtrend market, the Fibonacci Retracement is used to identify a counter trend or a retracement in the market which means, a temporary shift in the upward direction.
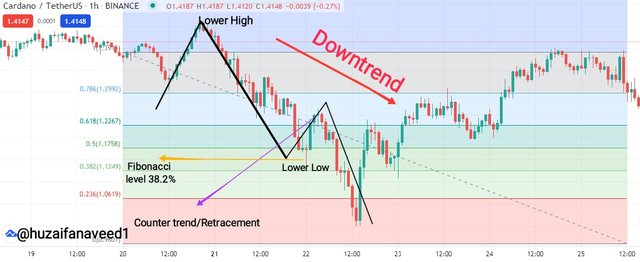
After a series or lower lows, we observe a shift, and a Retracement to a Higher Low level.
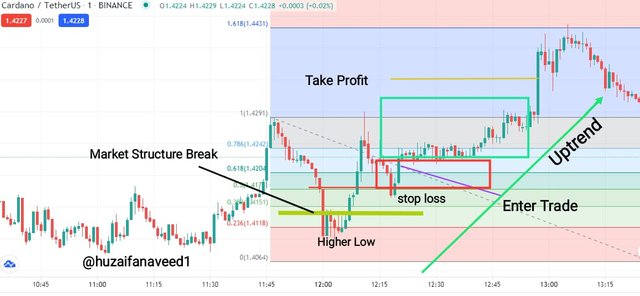
There are multiple strategies of entering the market. Such as the Market Structure Break, Fibonacci etc.
Since Fibonacci indicates the points between the High and low prices, I don't like entering the market relying only on Fibonacci.
Entering the Market with Fibonacci
Just like everything needs some sets of rules for it to work perfectly, similarly the Fibonacci has some rules.
- The market should have a significant trend, ie, Not fluctuating alot.
- It should either be an Uptrend or a Downtrend.
- There should he series of Highs and lows.
- set up Fibonacci between the High and Low prices points.
Fibonacci in uptrend
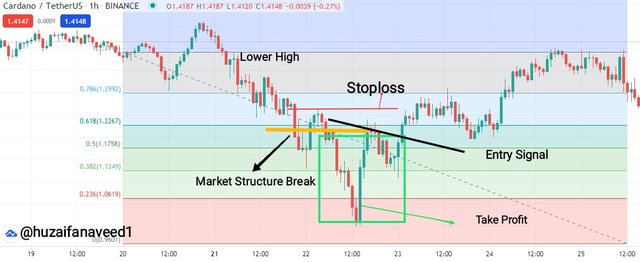
fibonacci in downtrend
Exiting The Market Using Fibonacci
Using the Fibonacci for exiting, I would recommend you the same thing I would recommend someone using the Market Structure Break. That is, to use the help of Stop loss and Take Profits
These two things will help you in exiting the market with minimum losses and maximum profits.
Stop Loss
Setting up a Stop Loss helps you in getting limited loss. For example if you set up a stop loss order for 15% below the price at which you invested in the asset, will limit your loss to 15%
While using Fibonacci, you can set the price a few pips above the Fibonacci level you used for entering.
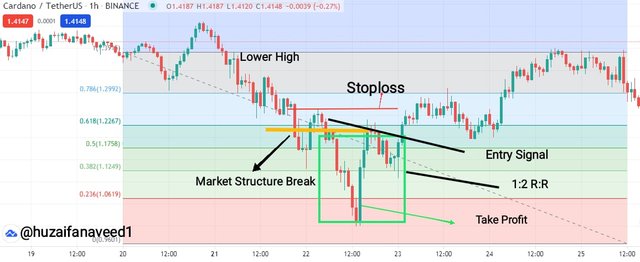
Take Profit
Take Profit is set up to maximize your Profits. For example you've bought an asset for $10 and you set the Take Profit order at $20. If the market price reaches the $20 mark, it will automatically be sold.
While using Fibonacci you can set it up in a 1:2 risk reward ratio.
Trade management using the Fibonacci could be a risky business but if you know how to use it, then you can make good profits.
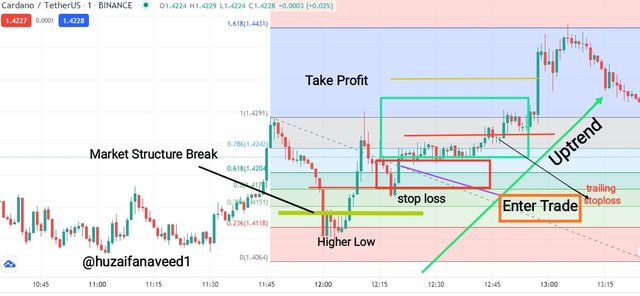
While trading you can set the Stop Losses at 5-10 pips above the Fibonacci Level.
Furthermore you can set up Trailing Stop loss, through which you can secure the profit you made. If the price of the asset moves to your favour, the stop loss will move with it.
Fibonacci might be good but it comes with limitations, which are, it can only be used in trending markets which could either be Uptrends or Downtrends. The Fibonacci measures the counter trend movements and retracements
Before entering the market, other indicators such as MACD(Moving average convergance divergence) RSI should be considered as well so that you get a complete hold of the market
This assignment comes to an end. In this assignment we learned about the Fibonacci Retracement Levels and different levels, numbers and sequences connected to it
It is an important tool which can be used for measuring the retracements in a trend. Setting up stop losses and take profits is also advisable while trading using Fibonacci so that you can maximize your profits and minimise your losses
Conclusively, I think Fibonacci is a very important tool which every trader should know
Thank you professor @yohan2on for this lecture. I enjoyed making it and hope you have a good read as well
Regards,
@huzaifanaveed1
NOTE: all pictures were taken from tradingview.com

Hi @huzaifanaveed1
Thanks for participating in the Steemit Crypto Academy
Feedback
You lacked a practical understanding of the Fibonacci retracement levels in trading. In all your charts the Fibonacci tool was wrongly plotted. The Fibonacci was hanging in the air. If you read my article you would learn that you had to locate 2 points on your chart on which you were to plot the Fibonacci.
Homework task
2
You are working excellent.
Thank you