Crypto Academy | Season 3 | Week 2 [Homework Post for professor @reminiscence01]
Hello everyone. A warm greeting to professor @reminiscence01 and to everyone reading this.
In this week's lecture we learned in detail about the charts and candlesticks
It feels good to be here making this assignment post for you professor.
In this assignment post we'll be learning about, charts, Japanese Candlesticks and much more
A chart, be it in a Cryptomarket or anywhere else, is a graphical representation of information conveyed. In a Cryptomarket, the chart tell us everything about the trading between traders. We can see the value of the assets. We can see the high and low prices of the assets. We can see the price variations of the assets through charts
There are multiple types of charts used in a Cryptomarket. Some examples are; Candlesticks chart, line chart, bar chart etc.
The Japanese Candlestick charts convey important information to us such as period's high, low, open and close.
--
They also help us in identifying trend reversals as well as support and resistance levels.
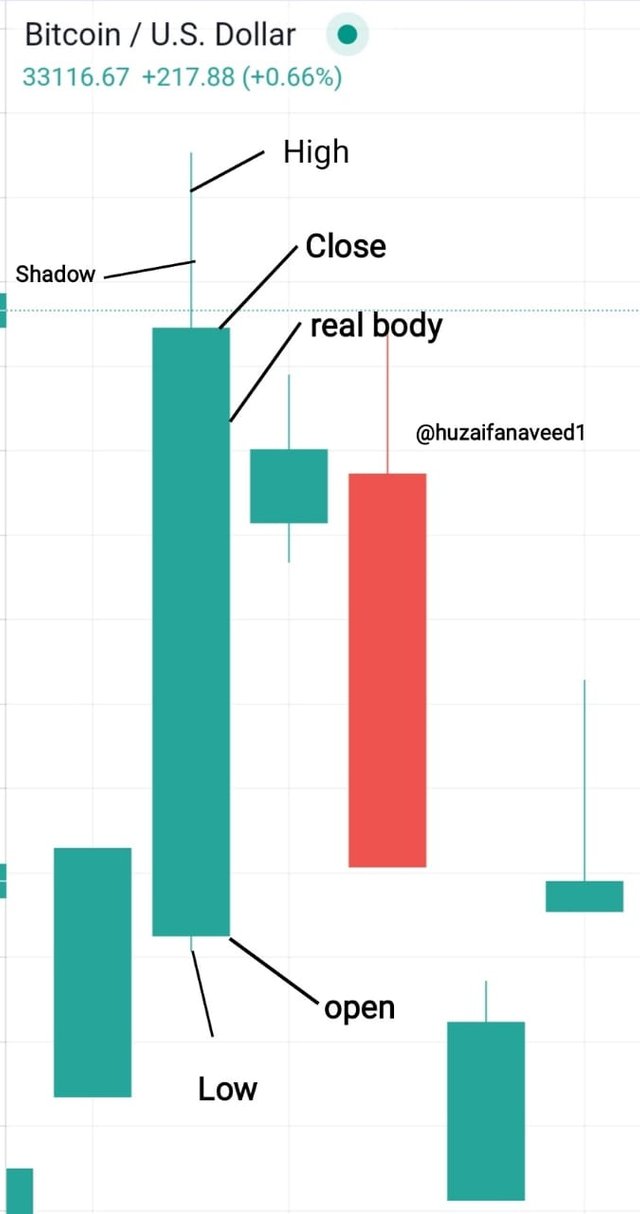
The most important elements of the Japanese Candlestick are;
High
Open
Close
Low
Shadow
- Real Body
Real Body
The real body is the main part of the Japanese Candlestick. It is either in green or red generally in the chart. The real body shows the price ranging between the high and low points.
High
The portion of the Candlestick conveys us the Top of the price movement in a certain period of time. The High point is the point abve the top shadow
Open
As the name suggests, A candlestick open is the opening price of a Candlestick.
Close
This is the closing price of a Candlestick. Through close we can determine future movement of the market trend.
Low
This is the part of the Japanese Candlestick which demonstrates the minimum price of the asset in a time period.
Shadow
This is the small line above or below the real body. Shadow is the point of the Candlestick which indicates where the price of an asset reached but couldn't be maintained there

2 Describe any two other types of charts
Bar Chart
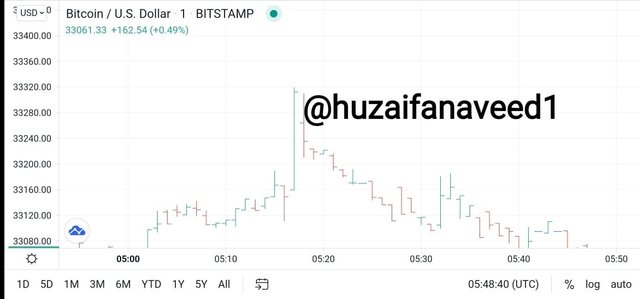
The bar chart is almost the same as Japanese Candlestick. It indicates the Open, close high and low of as asset in a period of time
The price of an asset is represented in the bar form. The important thing to differentiate in a bar chart is that alongside a vertical line on top of the bar, there is also a horizontal line which comes out of bars.
The vertical axis of the bar represents price, while the horizontal axis is associated with time.
I personally prefer candlestick chart over bar chart.
Line Chart
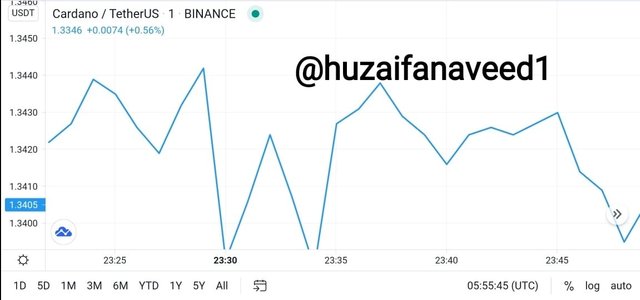
This is the simplest of Cryptocurrency charts. It is used to analyse the oriceyof an asset over a given period of time. It represents the closing price of an asset of the day.
Through a line chart, areas of resistance and support can also be identified. The important thing about the line chart is that it does not contain the shadows which we saw in the Candlestick Chart so it is easy to understand.
As the Line chart is made only with the closing prices of an asset, it is advisable to not to use it alone.

Why Japanese Candlestick charts are mostly used?
The Japanese Candlestick chart help significantly in identifying trend reversals and trend continuations.
Furthermore through the shadows they also indicate the sentiments of traders. The price range of an asset is also conveyed in the Candlestick.
A Japanese Candlestick contains, the high, low, open and close points of the price of an asset which gives the trader a complete idea of the asset he's interested in.
Candlesticks also provide better information regarding the price ranges and its fluctuations than any other chart. Through all this technical analysis becomes relatively very easy.

Candlesticks
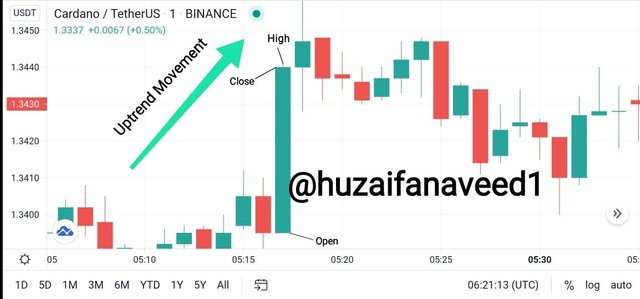
The candlesticks are in continuous movement in different directions. If a Candlestick is moving in an upward direction it is called as a bullish Candlestick. If the Candlestick is moving in a downward direction it'd be a bearish candlestick.
Bullish Candlestick
A bullish Candlestick moves in an upward direction in the market. The opening of the bullish Candlestick is higher than the closing through which it indicates an uptrend. When there are continuous bullish Candlesticks in a row, it forms an uptrend or a bull market
Bearish Candlestick
A bearish candlestick indicates a downward movement of a trend, it moves in a downward direction. When there are continuous bearish candlesticks in a row, they form a downtrend or a bear market
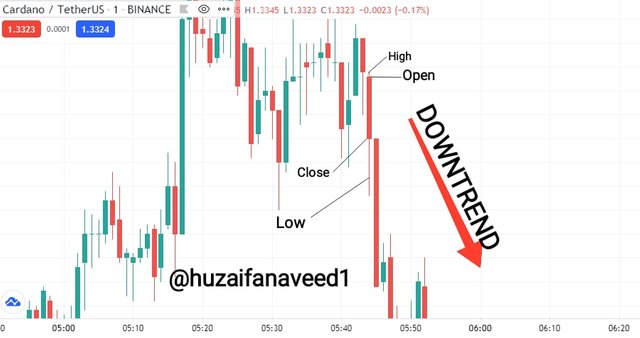

The Japanese Candlesticks help significantly in trading with detailed analysis of the Highs and lows. There are other charts as well but candlesticks are the most reliable ones to use.
This was a very good lecture professor @reminiscence01
Hope you had a good read.

Regards
@huzaifanaveed1
NOTE: *all screenshots were taken from tradingview


Hello @huzaifanaveed1 , I’m glad you participated in the 2nd week of the Beginner’s class at the Steemit Crypto Academy. Your grades in this task are as follows:
Observations:
Please remove this image with a company name. Use copyright free images.
Recommendation / Feedback:
You could have explored more on Japanese candlestick chart. Thank you for participating in this homework task.
Thank you for your review @reminiscence01
I dont get it though. What's wrong with my spelling and grammar? And what more do I need to improve on my markdown styles, if you could guide me through it? Also, I'd be really glad if you could tell me what more do I need to explore on Japanese Candlestick chart.
Thank you