Crypto Academy | Season 3 | Week 2 - [Homework Post for professor @cryptokraze] by @huzaifanaveed1
Hello professor @cryptokraze and to everyone reading this. This would be my first of many assignment posts for @cryptokraze
In this post we'll talk about market structure, higher highs and higher lows, and will also demonstrate my understanding on crypto assets.
Here we go;
In any crypto market or any general market there are only three ways for the trend to move. It's either a bullish trend where the trend would go in upwards direction, a bearish trend where the trend woul move in the downwards direction or the sideways direction.
The price always follows a specific pattern, in a swing movement which creates high points and low points, forming support and resistance levels, as explained by the professor in this lecture.
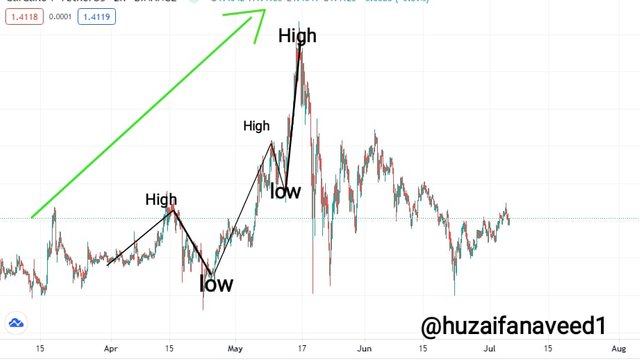
Uptrend
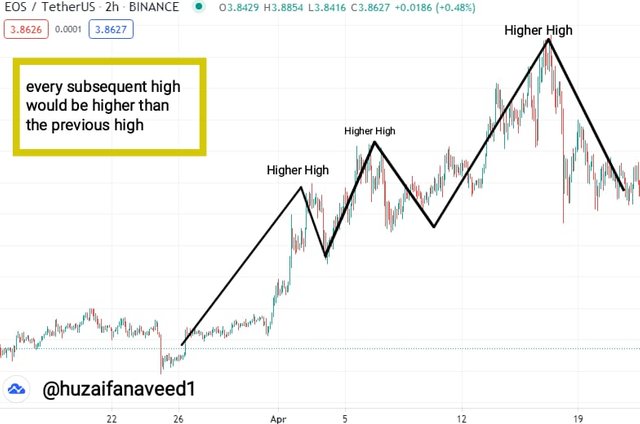
When the market is in an upwards movement, it isn't like that the price will go upwards in a single straight line. The price makes a swing movement with high points and low points. Every following high point would be higher than its last high point.
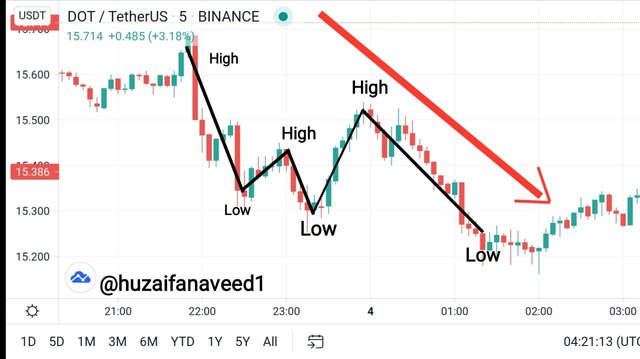
Downtrend
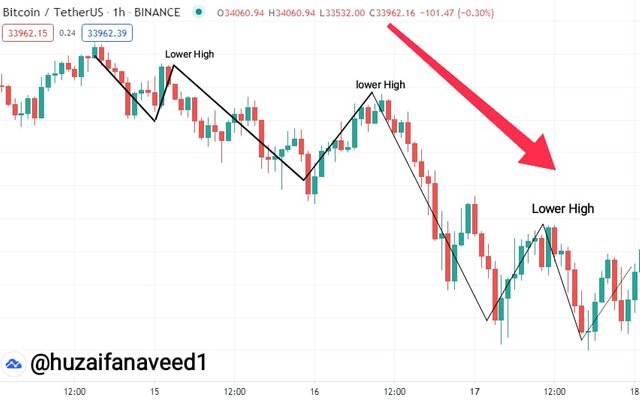
Similarly in the Downtrend market structure there are swing movements which create high and low points. Every following low point is lower than the previous low point.
Sideways movement
This is a rather consistent market where there are no majer swing high or low movements. Even though there are minor swing movements, but still the trend shows a sideways market structure

As discussed above when the market moves in a swing movement there are high and low points. In an there is an upward movement with successive highs but there are also Higher Highs and Higher lows.
Similarly in the downward movement there is constant downwards movement but there are also Lower Highs and Lower Highs
Lets have a better understanding with explaining each point separately with examples of EOS/USDT below:
Higher highs
When the market is moving upwards there are set of highs through the swing movement. The swing movement moving in the upward direction makes high points in which every new high is higher than the previous high. Due to this there is a constant uptrend movement.
*If the next high is lower than the previous high than it does not indicate a higher high
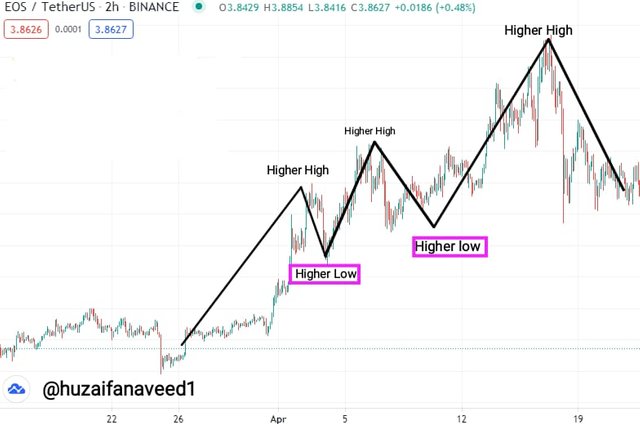
Higher Lows
In an upward swing movement there are higher lows which are usually formed after a high. After a higher low there is a following high which takes the market in an uptrend direction. The higher low shouldn't be lower than the previous low in an uptrend
Lower high
Lower high is found in a downtrend market trend. This is formed at the top of the uptrend as from this point the market takes a downward direction. This lower high will be below the last swing high.
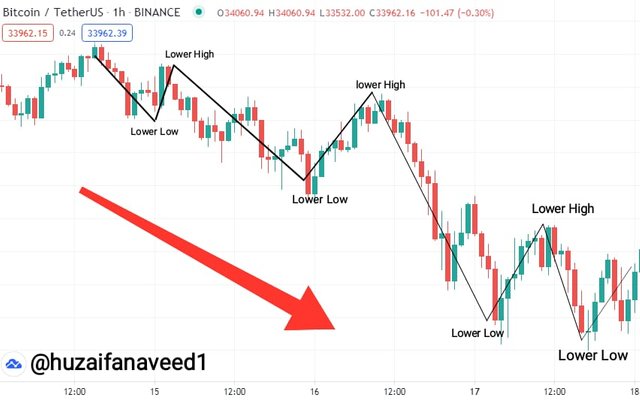
Lower Lows
This is the structure in a downtrend swing movement where is lower than the previous low. The structure after this low would be lower than it. So it is a consistent downward market movement. Every low point is lower than the previous low.
It is important to have a strong grip on the market while trading. Sometimes the market moving in an upward direction tends to take a downward direction. Traders who are not aware with the trend reversals often panic when this happens. In this lecture we learned about how to take control of the market by identifying Trend reversals early.
It is identified when;
there's a lower high at the top of an uptrend
there's a higher low at the end of the downtrend.
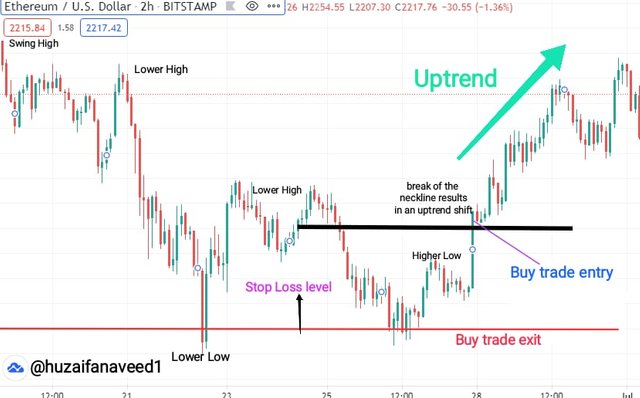
Early Uptrend Reversal
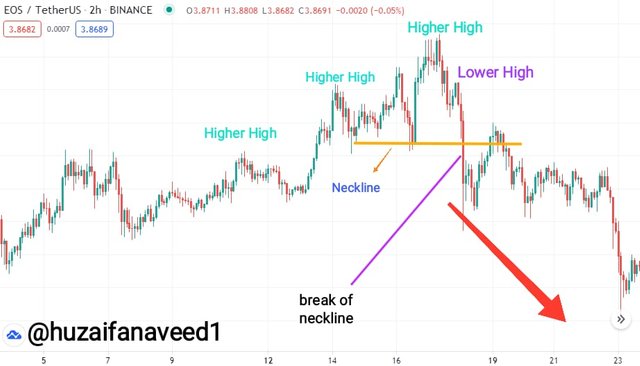
The trend reversal in an uptrend can be identified when we observe a lower high and a lower low at the top of the uptrend. We will make a neckline of the market structure as explained by the professor and when the price breaks the neckline it indicates a trend reversal
I will demonstrate this in a EOS/USDT CHART
Early Downtrend Reversal
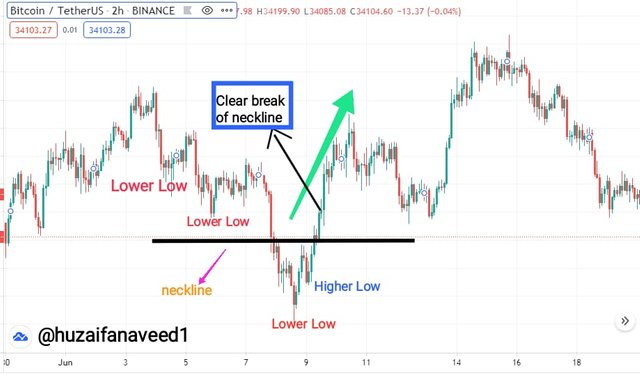
When there's higher low formed at the bottom of the Downtrend, similarly we will form a neckline and when the price of the assets forms a higher low at the bottom and crosses the neckline, it is an indication of a trend reversal.
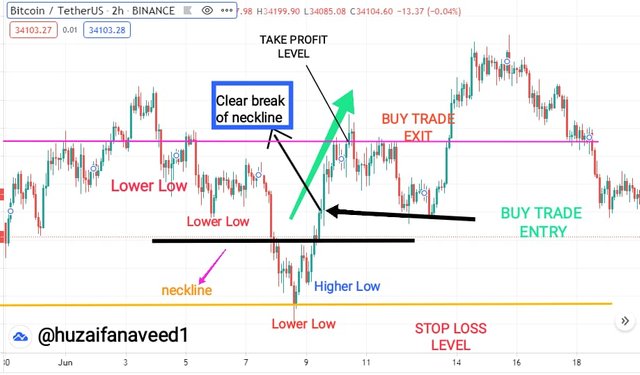
Demonstrating an example on BTC/USDT
The MSB strategy has some rules which you should follow before you trade for any assets. These rules are very important so that you get a good result.
Buy Entry Criteria
- The market should be moving in a downward movement, ie, a bearish trend.
- There should be consecutive Lower lows with a Higher Low at end.
- Once you determine the Higher low, you should make a Neckline which will serve you as a point if the market moves in an upward direction.
- wait for the market to break the neckline, forming a clear bull trend. This is the Market structure break.
- place your buy Buy trade above this Higher Low point.
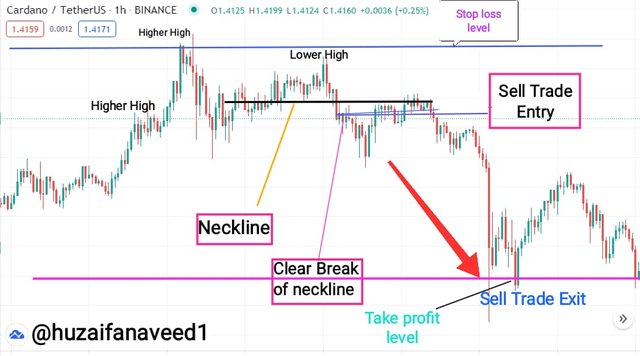
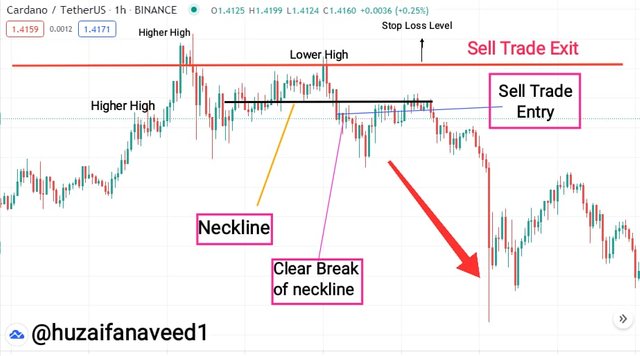
Sell entry criteria
- The market shoul be moving in an upward direction creating a bull market.
- There should be consecutive Higher Highs, with a Lower High at the end.
- Once the Lower High has been determined, set a neckline which will serve you as a point if the market shifts in a downward direction.
- wait for the market to break the neckline, forming a clear bearish trend. This is the Market structure break.
- place your sell order, just below the MSB.
Using our common sense, as well as the professor mentioned, that there could be two reasons of exiting the market.
a) You want to take profit
b) You want to prevent a loss.
a) Take Profit
- The market should be in an uptrend with a series of higher highs.
- Set a take profit level
- The take profit level should be 1:1 RR (Risk:Reward)
- When the market price hits the Take profit level, you can exit the market with profits before the market shifts in an opposite direction.
b) Prevent Loss
- for this, a Stop loss is very important.
- in a Sell Trade, the Stop Loss should be above the Lower High
- in a *Buy trade, the Stop Loss should be below the Higher low
- if the market hits the Stop loss. You'll exit the market with minimum loss.
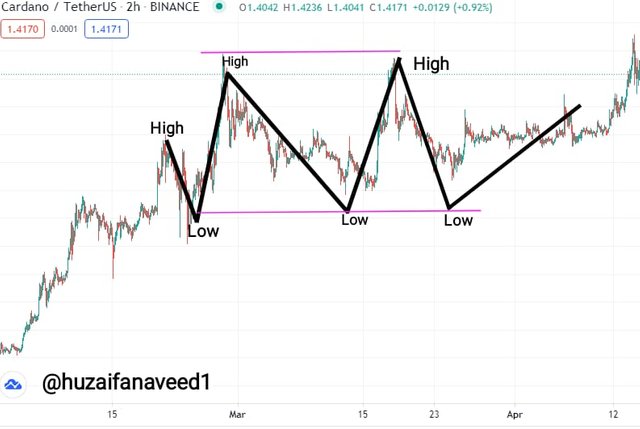
In this question I'll be demonstrating on a crypto asset where I will tell you where to place the buy order and where to place sell orders to take maximum profits and avoid losses
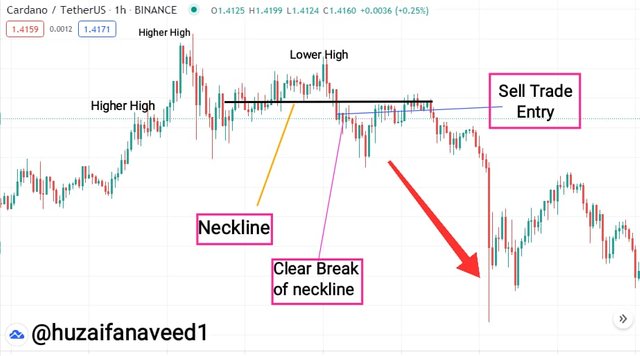
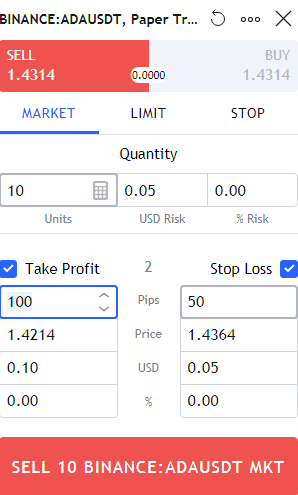
a) I used the 1 hour chart of ADA/USDT for this demonstration
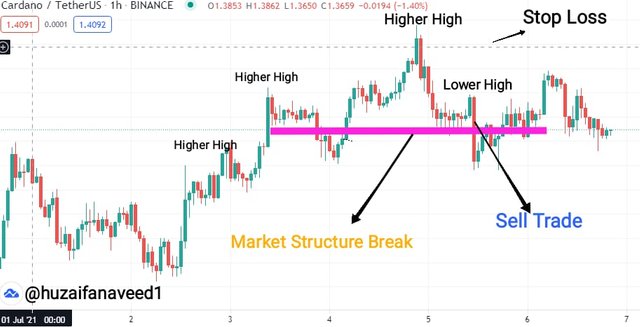
In this demonstration we can see series of Higher Highs and then finally a Lower. We wait for the Market Structure Break and place our sell trade to pull out with profits
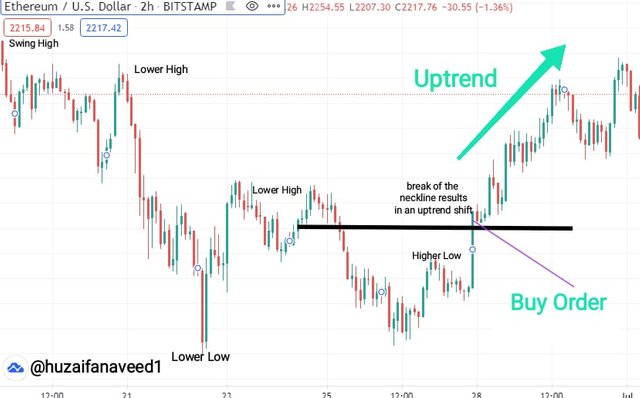
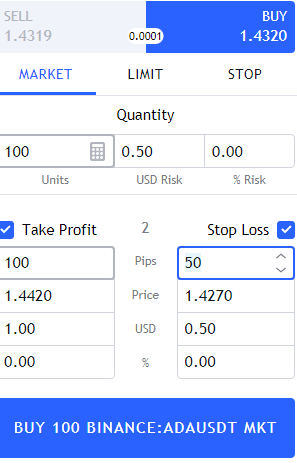
b) Second Demonstration
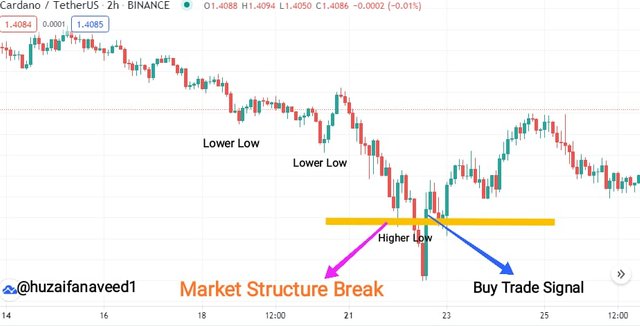
In this 2hour chart demonstration we see a series of Lower Lows with a Higher Low. We wait for the market to break theMarket Structure Break and wait for a clear breakout so that we don't get confused in the false breakouts. After the market has shifted we place our Buy Trade.
In the above screenshots you can see that to when placing the buy order you take the neckline into consideration and place the trade just above the neckline after a Higher Low. While when placing a sell order you should wait for the bull market to have a trend reversal which you can observe when you make a neckline while observing a Lower High. When the price breaks the neckline and starts moveing in a downward direction it is a good time to place a sell order.
One of my most favourites lecture of this season. Very easy to understand and an amazing strategy to use in the market.
In this lecture we learned all about the Market structure break. We learned how to determine a trend reversal, how to enter and exit the market with Maximum profits and minimum losses. An amazing example of trading practically. In my opinion the MSB is a must for every trader out there. Be it a forex market or a crypto market.
Lastly, thank you professor @cryptokraze I loved making this assignment. Hope you had a good read as well
Regards,
@huzaifanaveed1
NOTE: all the screenshots were taken from tradingview.com
