🌟Understanding the Doji Candlestick Pattern for Trading Success🌟.
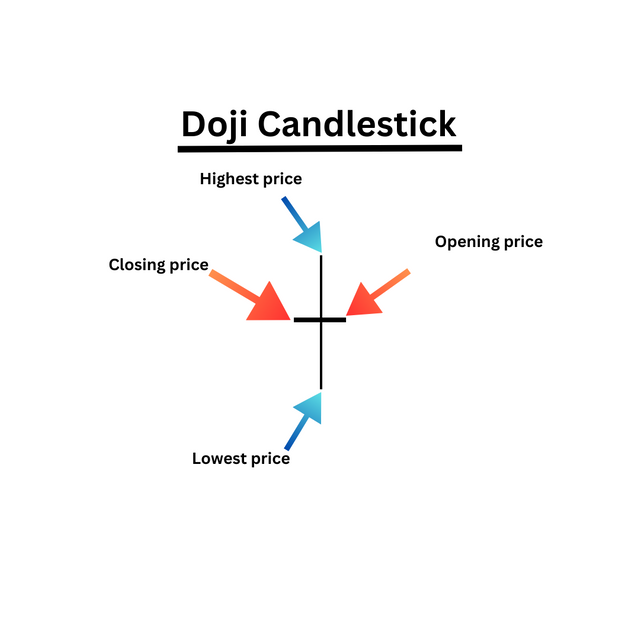
The Doji candlestick pattern is an essential part of Japanese candlestick charting. It is a clear indication of market indecision, where the opening and closing price are the same, and there is no clear control from buyers or sellers.
See the example below :
During periods of resting after significant market moves, traders often spot Doji candlesticks. When they occur in an uptrend or downtrend, it signals a potential market reversal.
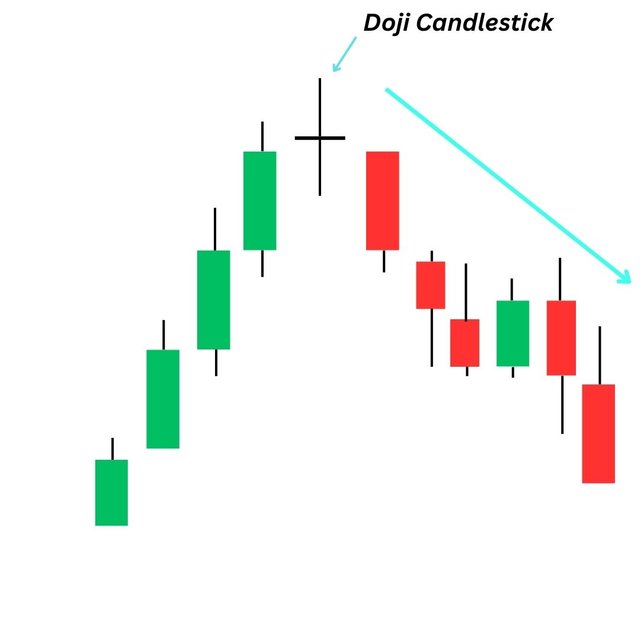
For instance, if the market has been trending upward, but a Doji candlestick forms, it may indicate that buyers are unable to maintain the price level, and sellers are pushing it back to the opening price. This is a clear indication that a trend reversal may be likely to happen.
A Doji candlestick can be used to take profits on existing trades, or as an entry signal in combination with other technical analysis. It's crucial to remember that a Doji signals market uncertainty, and its significance should be weighed against other indicators.
The chart above shows how the market changed direction after the
formation of the Doji candlestick.In conclusion, the Doji candlestick pattern is a valuable tool for traders seeking to interpret market movements and trends. Its occurrence during periods of market indecision should be closely observed to make informed trading decisions.

