Crypto Academy / Season 3 / Week 3 - Homework Post for Professor @lenonmc21 || All about Trends, Supports and Resistances and simple chart patterns || By @humblesoul
INTRODUCTION
The cryptocurrency market has a trading platform which at most are decentralised platforms which gives each trader or miner an opportunity or way to technically and fundamentally analysis market coins which were invested on. To that effect, the need for a trader to understand what the uptrend and downtrend lines in chart of trading is essential, this would be wise on the part of the trader because with the knowledge of an analyses of a crypto coin would enable a trader to take decisive action of at what piont a bullish and bearish period is taking place and how it crypto coin of trading would be under a good management system.

DEFINE IN YOUR OWN WORDS WHAT IS A "TREND" AND TREND LINES AND WHAT IS THEIR ROLE IN CHARTS
TREND
In a lay-man's understanding, this can be referred to as a general direction of something that is developing from a particular point or changing within a short period of time with the mindset of predicting it future changes which are done with the use of lines or otherwise.
In the trading system, this is a process where prices or market value of a cryptocurrency or an asset moves from a particular direction to another which might move as in bullish (uptrend) or bearish (downtrend) trend which possibly can't be predicted.
TREND LINES
These are undoubtedly identifiable lines or visual rendition which a trader or miner uses in a charts to indicate a prices series or support and resistance of a price speed between a period time and other data information found in the charts, with the use of the lines a trader or miner would know which best step is to be taken based on his investment and the current market analysis. There are two types of trendline based on it movements and directions: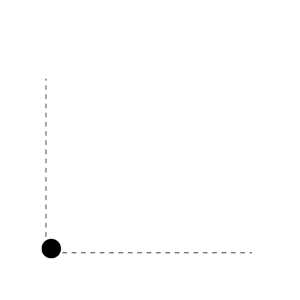
- ASCENDING (UPWARD TRENDLINE)
- DESCENDING (DOWNWARD TRENDLINE)
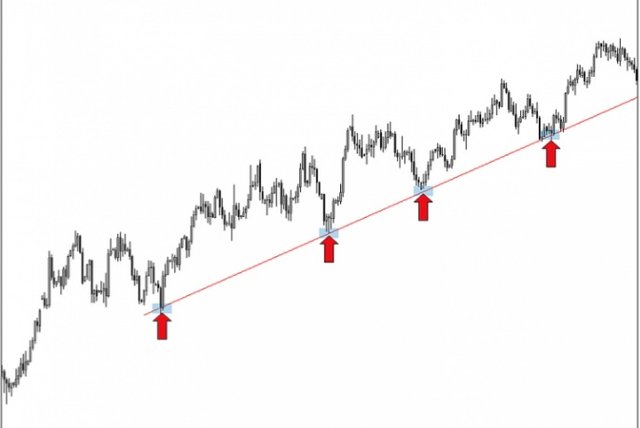
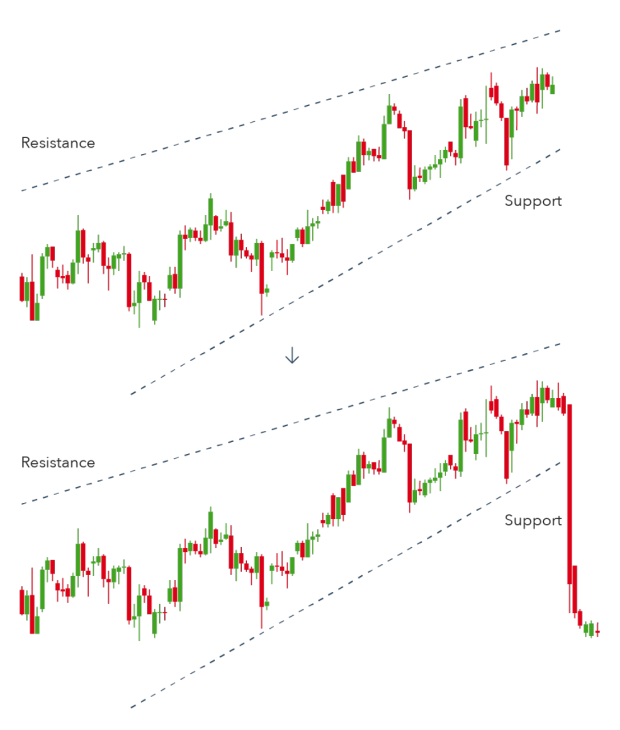
ASCENDING (UPWARD TRENDLINE)
 Source
Under this, the trendline has lines with an upward slope movement. Thus, Showing that the market of a particular cryptocurrency is moving in an up-trending and positive direction and the traders or buyers are dominating the market.this can be considered as a support level to the traders because it offer a little prediction of the next cryptocurrency market action and also shows that buyers are intruding into the market and that sellers are off the market of the cryptocurrency. During this, it can be referred to as a bullish period or trend.
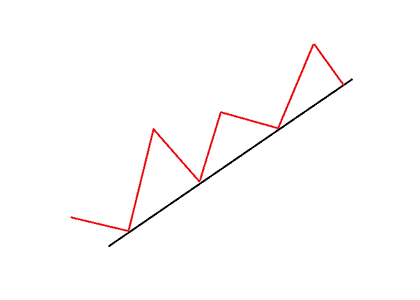
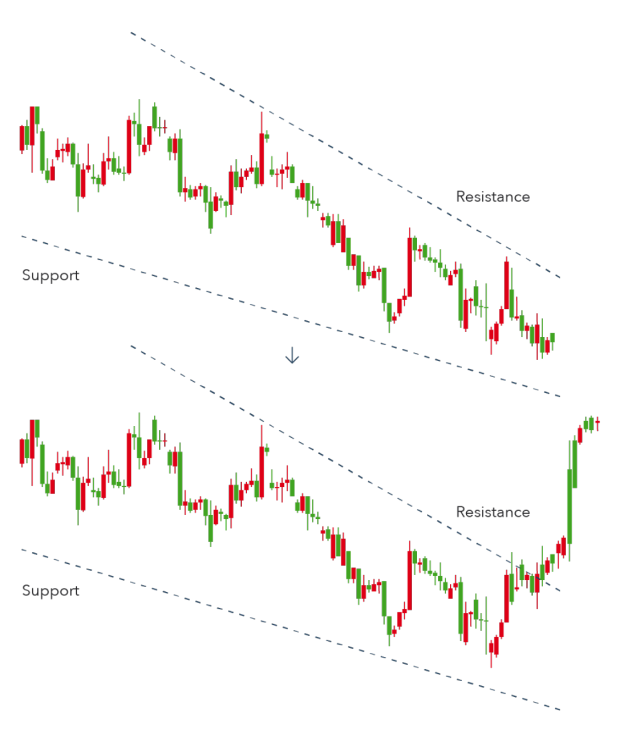
DESCENDING (DOWNWARD TRENDLINE)
 Source
Under this, the trendline has a line which shows the downward movement depicting that a particular cryptocurrency is under the impetus of the crypto coin sellers and that the cryptocurrency is moving down in the market analysis. This is actually considered as the opposite of ascending or upward trendline, in this, the resistance level is meant to be high because sellers of the particular cryptocurrency is increasing and perhaps,this can be said to be as a bearish period or trend.

PSYCHOLOGY BEHIND TRENDLINE
In a up-trending cryptocurrency market, when one oscillate low and higher lows through a line, then it forms a trendline which stands as a support in the price chart. This indicates that the market price of a cryptocurrency lays on the hand of the trenders or buyers in the sense that whenever a buyer accumulates coin it possible to have a raise in the trendline charts, which also applies to when the buyer decides to take-off it profits from his investment on the cryptocurrency.
In the cryptocurrency trading system, there is always the activity of sellers coming in and buyers go6ong out the trading lane and whenever such takes place, it creates resistance or resilience in the system and will make prices to reminisce. If there is much sellers in tbe market system at a particular period of time, the price of the coin would move back up which will make it move higher than the previous high to a new higer high.
EXPLAIN HOW TO DRAW AN UPTREND LINE AND A DOWNTREND LINE (SHOW A SCREENSHOT OF EACH)
UPTREND LINE
 Source
As you can see from the image above, to draw an uptrend line, one needs a supporting point of two or more areas or point in the chart, when those points are detected, You will have to draw a straight line up in order to connect the points that has been detected.
DOWNTREND
.png) Source
Source
As you can see from the image above, to draw a downtrend line, one needs a resistance point of two or more points in the chart, when this points are found the striaght lines are drawn downtrend in connection with the points.
DEFINE IN YOUR OWN WORDS WHAT "SUPPORTS AND RESISTANCES ARE AND HOW WE CAN IDENTIFY BOTH ZONES (SHOW A SCREENSHOT OF EACH ONE)
SUPPORT LEVEL
 Source
This is a period when prices of a cryptocurrency stop going down (downtrend) on a regular basics but bounce back to it price expectations which at this time, traders will accumulate coins for a near-take profit time.
There are two types of Support level under trendlines, which includes:
- Horizontal Support
- Diagonal Support
Horizontal Support
 Source
Diagonal Support
 Source
Under this, the both support diagram are formed through the low connection but when a coin is in an up-trending movement the diagonal support which is low unintermittedly becomes higher.
Under the diagonal support image, you will understand that the trend is up going not going down although, a trader who identify the support would take the decisive action to accumulate coins near the support level.
RESISTANCE LEVEL
 Source
This is a period when a cryptocurrency price in the market system begins to decrease which would result to downtrending in the charts, this is also a time where traders takes off their profit of the crypto coins invested on which would bonunce off the balance and expectations of it investors.
The facts is that, whenever the sellers in the market system is higher than the buyers, there is a possibility of the coins or assets to decrease in prices and value, same also applies to if the buyers are much more than the sellers that would reflect on the cryptocurrency analysis and will cause an increase in the price movement.
There are two types of resistance level under trendlines, which includes:
- Horizontal Resistance
- Diagonal Resistance
EXPLAIN IN YOUR OWN WORDS AT LEAST 2 SIMPLE CHART PATTERNS WITH SCREENSHOT
There are many types of chart pattern which has it own techincal analysis, I will be discussing on three patterns among many, they include:
- Symmetrical Triangle Pattern
- Wedge Pattern
- Cup and Handle Pattern
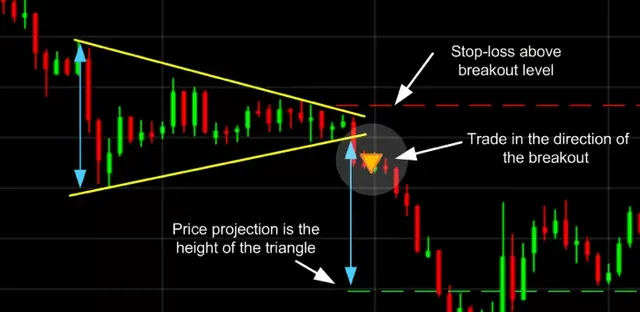
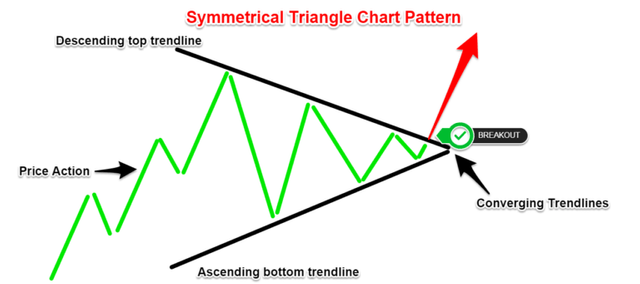
SYMMETRICAL TRIANGLE PATTERN
 Source
This also can be referred to as a continuation pattern, where a trendline moves in an upward directions with it lines in a ascending bottom line which also has a downward movement with a trendline descending from the top of the chart, as you can see from the image above.
 Source
Based on the above image, the triangle pattern is made possible with the use of two lines that are drawn in sloping direction which later met at a point therefore for this pattern n to work out more fully, it requires that the trendline has a two hit point.
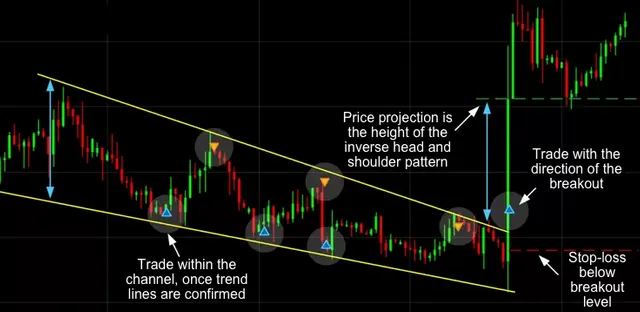
WEDGE PATTERN
 Source
This can be said that the movement of price that is between the resistance and support is screwing up. This pattern can be identified whenever a two trendline in a chart is moving in one direction that is either downward or upward just as the image above depicts which has it upward wedge pass through the support while the downtrend passes through the resistance that are been displayed in a chart.
Under this pattern, there is an ascending wedge and a decending wedge, which i would like to talk on:
ASCENDING WEDGE
 Source
From the image above, the charts depicts that the price movement is in an uptrend position which also indicates a slow boost of the market price with a prediction of price drop based in the cryptocurrency been a analysed.
DESCENDING WEDGE
Source
From the image above, the falling wedge shows a downside slow boost of the market price which might cause an uptrend movement to fallback, this can place a prediction on the price of a particular coin to raise higher than expectations.
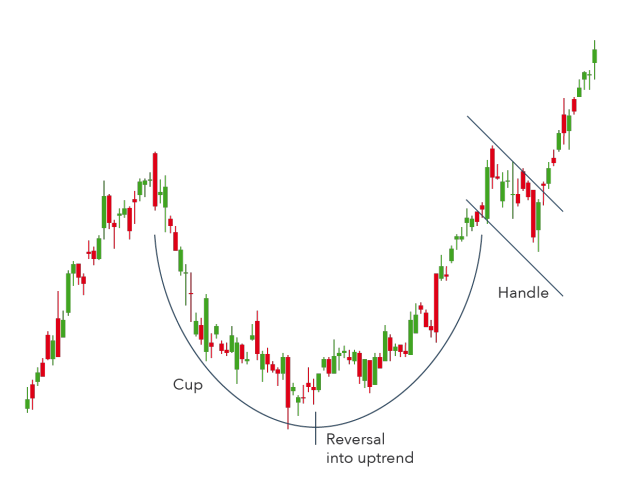
CUP AND HANDLE PATTERN
 Source
This pattern has an actual shape of a cup and it handle remember that such has different designs made available Meanwhile, based on this pattern it has different shapes which might comes as V or U Shape in the tradingsystem.
This is used in the bearish and bullish market trend system where movements of price of a particular cryptocurrency goes just like a cup handle shape, based on the handle which serves as a retracement because after the two parallel lines is done with it activity the bullish trend of the market price process on. A bearish period is not mostly seem in this pattern but there is always a possibility that whenever there is a downtrend in the system a slightly reflection will take place but this wouldn't cause any harm in the trading because there is an outstanding handle available to form up in replace of the handle if it ever falls in the chart.
TIP FOR CHART PATTERNS
Each of the above mentioned patterns has a strategy which has a key that can enable one to freely run it analysis, this can be done with the use of Contract for Difference Trading (CFDs) with that mentioned, one can hypothesize market analysis and evaluate it bullish and bearish period.
Based on the strategy area, it's important that in any cryptocurrencies market analysis, the need to identify it uptrends or downtrendlines is essential, analysing the support or resistance trends is required same as time to take profit in the market system, strictly following the strategy meant for a particular partten is very vital as atrader in order to avoid unnecessary loss.
CONCLUSION
With the use of the pattern mentioned in this homework and of this weeks lecture, one as a trader can easily understand fully just at a glance on how a cryptocurrency market system is moving with the aid of it support or resistance or better still, analysis it and create a prediction of it future outcome.
Hence, the use of trendline has been a good tools innovated to enable a trader technically and fundamentally analysis it cryptocurrency which has help to crop the risk of losing. Thank You professor @lenonmc21 for your wonderful lectures, I hope to learn more from you next time.