Crypto Academy / Season 3 / Week 2 - Homework Post for professor @reminiscence01 || Introduction to Charts || By @humblesoul

EXPLAIN THE JAPANESE CANDLESTICK CHART (CHART SCREENSHOT REQUIRED)
CHART, WHAT IS IT
CRYPTO CHART, WHAT IS IT
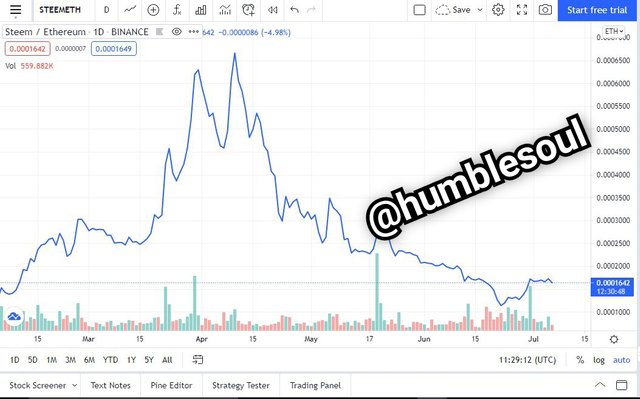
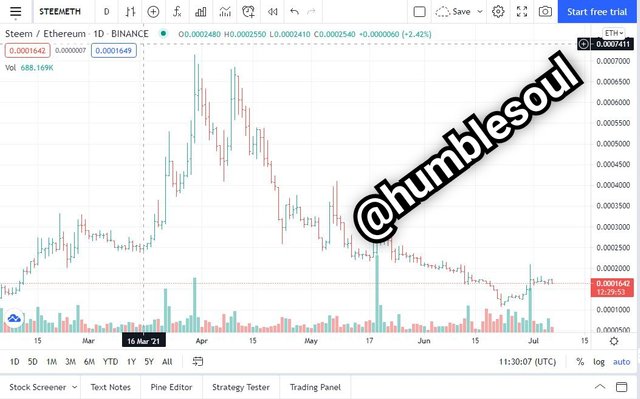
JAPANESE CANDLESTICK CHART
.jpeg)
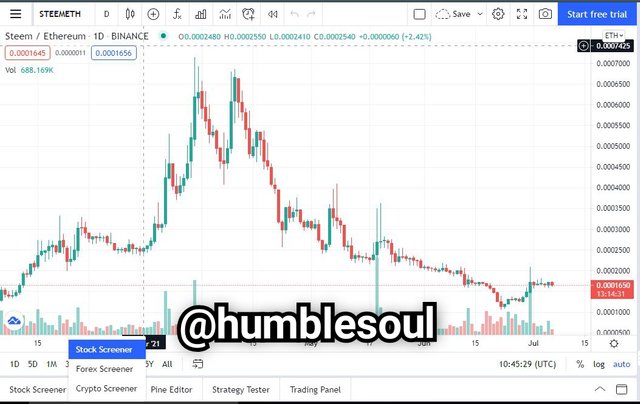
With the aid of this chart while trading, a candlestick shows the opening prices, closing prices most times at it highest points or lower point of a cryptocurrency price of a particular time, in other words, this charts helps to unvail the bearish and bullish trends in a crypto coin.
REPRESENTATION UNDER JAPANESE CANDLESTICK CHART
PICTURE A
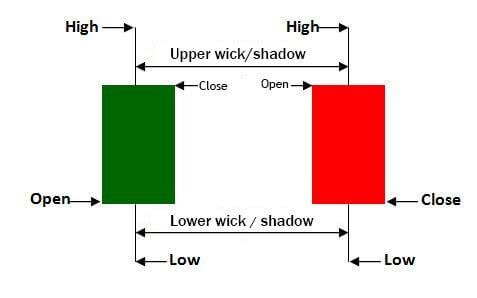 Image Source
From the picture above, you will see the following:
- Green Bar: this shows the uptrend price movement of a cryptocurrency meanwhile the top indicates close while the down is open, this can also be referred to as the bullish trend period.
- Red Bar: shows the downtrend proce movement of a cryptocurrency, in this the top is open while the down is close, this can also be referred to as the bearish trwnd period.
PICTURE B
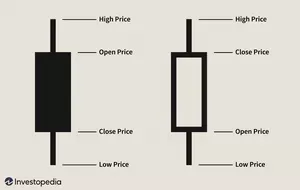 Image Source
In cases where the bars are seen otherwise, this follows:
- Black bar: represents a downtrend movement of cryptocurrencies in price.
- White bar: Represents an uptrend price movement of a cryptocurrency.
Realistically, the candlestick looks like a body that has a tail, this tail or wick attached which might appear in a red or green bar shows the highest or lowest piont or even the opening or closing rate the market has reached within a particular period hence this will reflect on high or low volatility of the market based on cryptocurrencies.
CANDLESTICK BODY COMPONENT
From the above picture, this candlestick has two major elements which are the body and the shadow thereafter it has the following characteristics:
- High
- Close
- Open
- Low
- Shadow
- Real body
| COMPONENT | FEATURE |
|---|---|
| HIGH | The highest price or level of a particular coin in a given time. |
| CLOSE | The closing price or level of a particular coin in a given time. |
| OPEN | The startup price of a particular coin at a given time. |
| LOW | the downfall prices or a lower price of a particular cryptocurrency. |
| SHADOW | this shows the prices rate for the day or time which traders has trade on the coin with a result of either a low or high price. |
| REAL BODY | it covers the full details ranging from the opening to the closing prices range of a particular time. |
To enable this chart to run smoothly patterns has made available for a quck analysis of the chart, these include:
- Single Pattern
- Double Pattern
- Triple Pattern
SINGLE PATTERN
This focuses on one trading period or time in fact this is among the easiest partten made available and it serves a step stone to another pattern in the market analysis. Under this pattern, the following can be found:
- Spinning top
- Hammer
- Shooting star
DOUBLE PATTERN
This focuses on two period formed from the market signal which appers on the uptrend. Under this pattern, the following can be found:
- Harami
- Tweezers
- Homing pigeon
TRIPLE PATTERN
This is considered the strongest among the pattern available because of it signal and it three way period. Under this, the following can be found:
- Morning Star
- Three white soldier
- Evening Star
DESCRIBE ANY OTHER TWO TYPES OF CHARTS?
Among the numerous charts made available for market price analysis, I would chosse the following:
- Line Chart
- Bar Chart
LINE CHART
This is one of the simplest chart to understand, just with peep at it because more detailed information or data are not actually provided on the chart. From the image above, you see that its just a line that is drawn from a particular piont of price to another piont.
BAR CHART
In this chart, more details for a better analysis is added to it, it displays the opening and closing price of a cryptocurrency along with highest or lowest rate available, as you can see from the image below, You can see where the price is opened on the left of the bar, it movement that is low and the high rate it traded with it closing price.
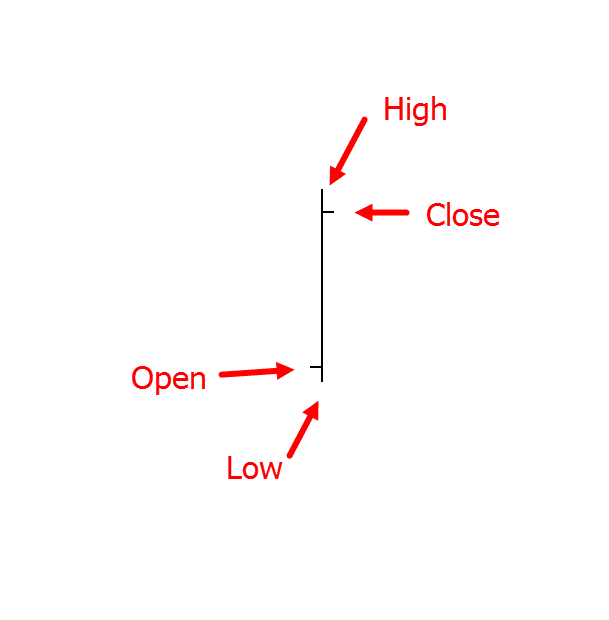 Image Source
Although, this is a one period data release it can still be manipulated meanwhile the (OHLC) govern this chart.
IN YOUR OWN WORDS, EXPLAIN WHY THE JAPANESE CANDLESTICK CHART IS MOSTLY USED BY TRADERS
In my understanding, the reason is because, this tools is the best for technical Analysis which enables a trader with an ease understandable method of the market price of a cryptocurrency with the use of (OHLC) open, high, low, close that signals at a glance of the chart. With the chart,A trader can understand the market language as to it direction or decision that should be taken either for benefits reasons or loss prevention.
Meanwhile, a price movement can be varied to ascertain the previous to the current or future. Infact, thanks to the Japanese who discovered this instrument and to others who forwarded the tools for better implementation because this tools give every bit to a trader without data shortage or story.
DESCRIBE A BULLISH CANDLE AND A BEARISH CANDLE IDENTIFYING ITS ANATOMY
BULLISH CANDLE / TRENDS ANATOMY
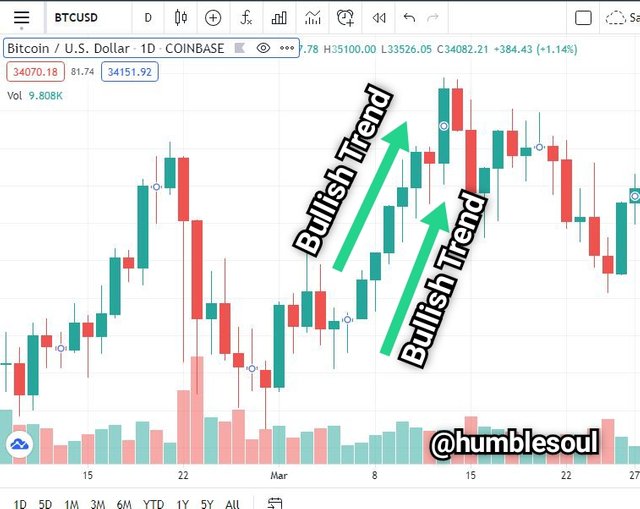
This candle is seen whenever the price of a said cryptocurrency is on the move in other words, when the movement increases, it uptrends and sends a huge signal to the market for traders to make a decisive action. In most cases, it a continuous step-up of price movement.
BEARISH CANDLE/ TRENDS ANATOMY
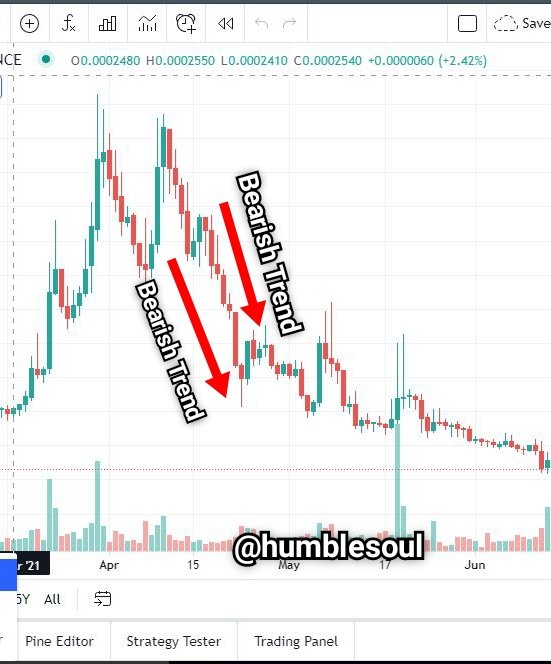
This candle signals a decrease in price of an asset or cryptocurrency most time this occur regularly which would send a bad signal to the market because whenever an asset is sold below the opening price downtrending would be expected.
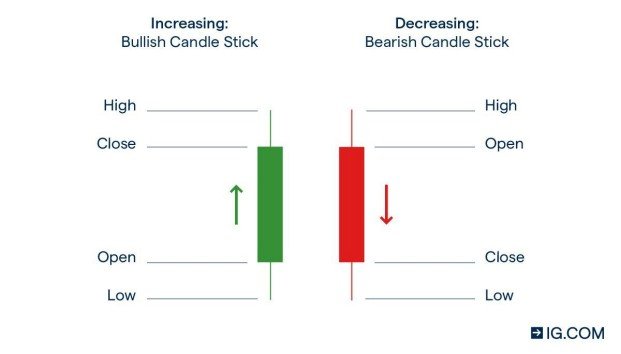 Image Source
SUMMARY UNDER IT'S ANATOMY
| PARTS | BULLISH FEATURE & BEARISH FEATURE |
|---|---|
| HIGH | The highest price it has been sold or it biggest transaction done on the asset in a particular period of time. |
| CLOSE | The closing rate or level of an asset in a particular given time. |
| OPEN | The startup price of a particular coin at a given time. |
| LOW | The low-priced or rate available for an asset in a given time or duration. |
CONCLUSION
It's been said money will go into your pocket when you make the correct calculation or transaction.
Since the innovative has been in use, as a trader I will continue to use it in order to analysis how the market moves with a clear description, this chart helps the traders or investor in bring up a glance of a decision that could be taken with benefits or less. Therefore this weks lecture has given me the opportunity to expore more on thus charts and how it works, Thank You professor @reminiscence01 for your well-detailed lecture, I hope to learn more from you next time.
Hello @humblesoul, I’m glad you participated in the 2nd week of the Beginner’s class at the Steemit Crypto Academy. Your grades in this task are as follows:
Observations:
The color of the candlestick doesn't really matter. What matters is the closing price of the candle. Candlestick colour can be customised to any colour by the trader. Emphasis is layed on the closing price to determine if price is bullish or bearish.
Recommendation / Feedback:
I'm impressed with the research you carried out to produce this content. Keep the good work up. Thank you for participating in this homework task.
Thank You Very Much My highly esteemed professor @reminiscence01, for Your review. I will continue to give @cryptoacademy the best.