Crypto Academy /Season 3/ Week 7 - Homework post for professor @lenonmc21/ Analysis and Trading with the indicators " Stochastic Oscillator" and "Parabolic Sar"

What is Stochastic ostilator?
As an indicator, stochastic oscillator is commonly employed in trading to identify probable trend reversals before they happen. As the name suggests, the indicator compares a market closing price to its trading range for the period in question.
Stochastic ostilator has two lines: the stochastic oscillator ( % K) and a signal line (% D), which is the three-day simple moving average of percent K.
The intersection of these two lines shows the possibility of a trend shift. The most recent closing price is closer to the lowest low of the look-back period than it was in the preceding three sessions in a chart with a pronounced positive trend, for example, when the signal line crosses downward. Prices dropping to the lower end of the trading range may indicate that bulls are losing steam after a long period of rising prices.
Overbought or oversold conditions can also be detected using stochastic oscillators. Overbought situations are indicated by readings over 80, while oversold conditions are indicated by readings under 20 on the stochastic oscillator, which runs from 0 to 100. They are considered to be particularly strong signals when they appear in these outer area
Component of Stochastic ostilator
In stochastic, there are only two lines, K% and D%. As follows:
Most recent closing price - lowest price. The K line is 100% of the whole line length.
The three-day simple moving average (SMA) of %K = line
Amount in percent
Indicators and signals
Observations on the Stochastic
There are two lines in the stochastic oscillator and they're scaled from 0 to 100.
You can see the current closing price in the first line, also known as %K, in relation to the price range you have selected.
Using the %K line as a base, the second line is a simple moving average (SMA)
The concept of overbought position
The Stochastic Oscillator is limited to a range of 0-100, as we said previously. When the Stochastics Oscillator rises above the range of 80, the market is said to be overbought. This allows the traders to make a more informed judgment when trading. As a result of this position, the trader should sell their currency because the market is on an uptrend. In addition, there is a downturn following every upswing. As a result, the coin should be sold in order to make a large profit.
The concept of Oversold Position
Markets are considered oversold when the Stochastic Oscillator falls below the 20-point range. For traders, the oversold position is the ideal opportunity to buy coins because the price is cheap at that moment.
2 ways to use Stochastic ostilator in a trade
- To Trace Possible Reversal Trend
The Stochastic Oscillator can be used to detect a trend reversal. After an asset has moved in a certain direction, traders look at the stochastic line to see if the trend will retrace.
A positive trend may be shown on an asset's price chart, yet its stochastic line may reach an overbought zone.
- STOCHSTIC OPERATOR HAS A SECOND IMPORTANT ASPECT: THE TRADE SIGNAL When trading, the trader will use the % k and D lines to determine how much risk they want to take.
Buying may be a smart choice as soon as the two stochastic lines cross upwards. Any time these lines cross and an asset reaches excessively high levels, a trader may want to consider selling.
What is Parabolic sar
Define in your own words, what is Parabolic Sar?
Parabolic sar can be define as a leading indicator that uses the Parabolic Stop and Reverse (PSR) indicator A single parabolic line (or dots) indicates an upward trend, while a single parabolic line indicates a downward trend (or dots).
There are three primary purposes of the Parabolic SAR. This is a two-part process. This is also a potential entry signal. As a final benefit, it might be used as a warning indicator.
What the price must do for Parabolic sar to change from Bullish to bearish and vice versa
An acceleration factor (AF) is used in conjunction with the most recent extreme price (EP) to decide where the indicator dots will appear.
The formula for calculating it can be found below.
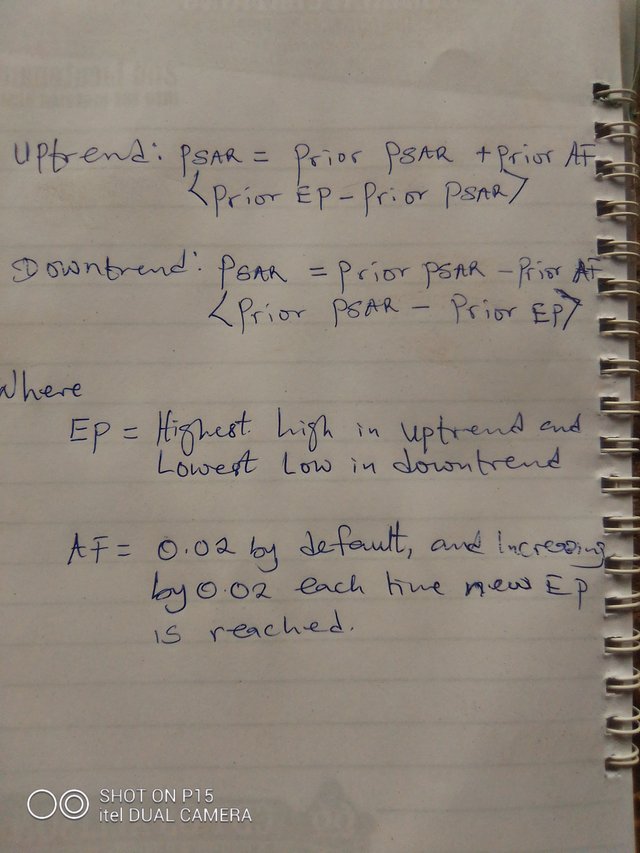
A dot (which can be connected with a line if wanted) is created below the rising price action, or above the dropping price action, using this equation. The dots serve as a visual cue to the current price trend. To compensate for the absence of dots on the indicator, it is referred to as a "stop and reverse" indicator. Dots appear on top of price bars when price falls below rising dots. After dropping dots, the price rises and flips the dots.
Calculations can be automated with charting software, but it's still helpful to know how to calculate it yourself.
Two ways to use Parabolic sar in a trade
Parabolic sar has various uses in trading but the two most common use are:
To Trace Possible Reversal Trend
The mojor use of parabolic sar is to give us insight on when a market is likely to reverse, this will help traders to make a choice of either entering the trade or come out of the market.Can serve as a trade signal
Parabolic sar tho may not be fully rely upon, the but if use along with others indicators for confirmation, it can serve as a solid signals which will guide us in our trading.
Section B
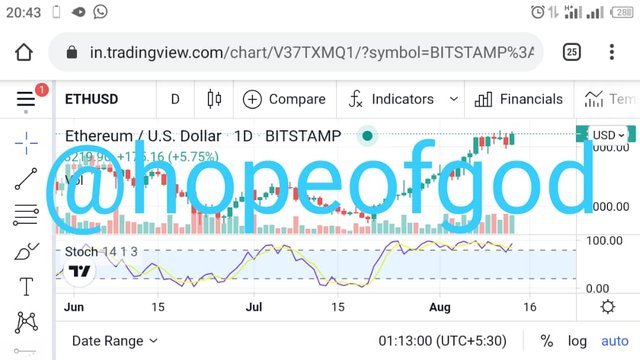
How to add Stochastic ostilator to a chat
To add Stochastic ostilator to a chat, you will first need to visit tradingview main site, www.tradingview.com and login to your account, after suçcessful login, crow down to overview and select the currency pair you will like to trade e.g Eth/USD is in my case.
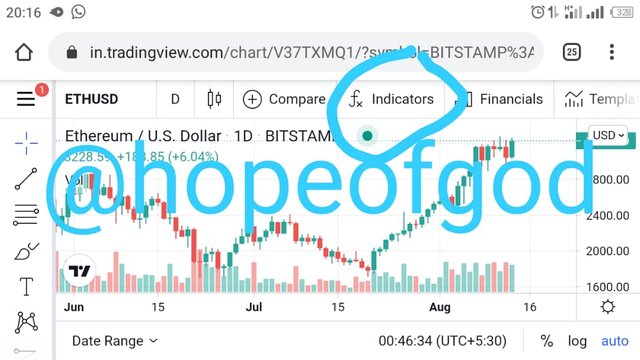
Next is to click on the chat icon as seen below to load the chat for the pair you have selected
After the chat has been load successfully, click on indicators as shown below
A drop down menu will show up listing all the available indicators, scroll down to sellect stochastic ostilator as seen below or use the search button if you have problem finding it
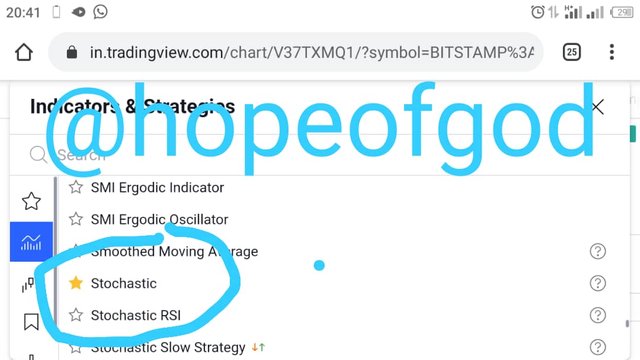
Once you find it click on it or click on the star icon to add it to your chat. After that go back to you chat to see it down the chat.
How to add Parabolic sar to a chat.
To add Parabolic sar to our existing chat all will have to do is to click on indicators as shown below
It bring up a drop down menu, just like the case of stochastic ostilator, but now search for "Parabolic sar" and star it. Then you should have a chat like below.
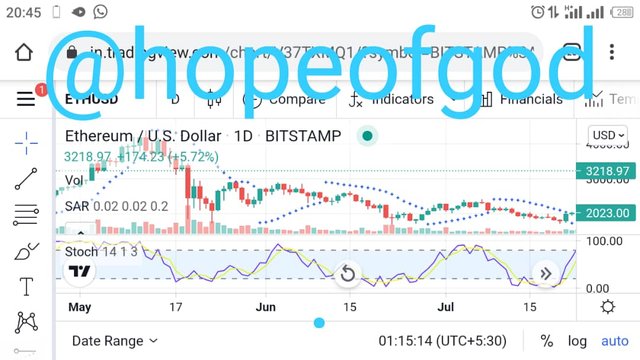
Congratulations, you have add Parabolic sar to your chat.
How to take a trade using the two indicators
Just as I said earlier in the first section, a single indicators may not give us the level of assurance we need to enter a trade but if stochastic ostilator and parabolic sar Marge together and the both point to a reverse trend ( stochastic ostilator cross each other above the 80 point or below 20 while the parabolic sar also put a dot down the current trend, the we have an assurance that a Reversal is going to happen. And then we can make a decision either to sell or to buy as the case may be.
Conclusion. Both stochastic ostilator and parabolic sar are Reversal Trend indicators, the knowledge of how to apply both will help a trader to make a smart choice, am happy am part of the class to learn how to use both indicators.
Thanks