Understanding Trend — Crypto Academy || S5W1 — Homework Post for @reminiscence01

It is already season 5 of our conventional university on this platform and I want to welcome us to this week 1 class. I hope to do a better presentation as we look into the theme "Understanding Trend".

When there is a perception of predilection of a financial market trending in a specific direction over time, it is referred to as a trending market. A trending market can also be said to be one in which there is a one-directional move of price either upward or downward. In a Trending Market, there may be various price turnings but around a fixed center such that it doesn't alter or influence the entire trend direction. The trends can be long, medium or short term hence can linger for minutes, hours, weeks, or even months in the case of long-term trends. Market trends are price propensities that are predictable within the scope or range of the market when price attain support and resistance levels, differing as time passes. Consequently, with the use of technical analysis, the market trend can be identified.
Bullish Trend:
When the bulls are in charge of the market, the market is said to be bullish, that's to say that the bulls are influencing the market pushing the price of an asset upward. This makes the price move in an upward direction which is referred to as a bullish trend. A bullish trend also called Uptrend indicates the rising or upward movement of price over a while. This as explained by the professor is a situation in which the price of assets makes higher highs and higher lows resulting from expanded psychological and fundamental factors and depicted by massive purchasing pressure exercised by the bulls.
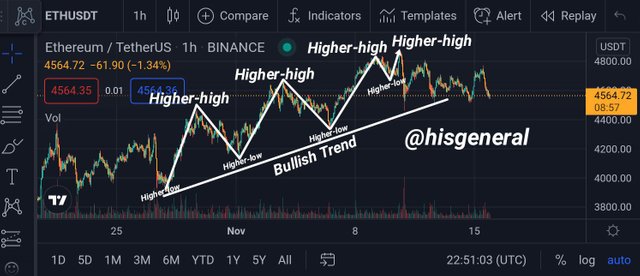
Ethereum/TetherUS Chart
Bearish Trend:
This is the direct opposite of the bullish trend, the bears are influencing the market and the price of assets. Therefore, a bearish trend implies a progressional downward movement of price, a decline in broad market indices. It displays the transition from the positiveness of investors to fear despondency. In a bearish trend, assets' price makes lower lows and lower highs, termed as downtrend and resulting from the decline of psychological and fundamental factors. A bearish trend is characterized by massive selling pressure which pushes down the price of assets.
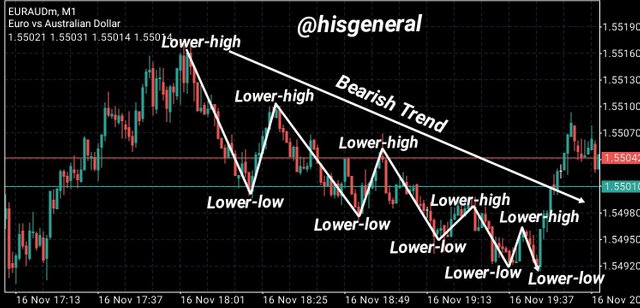
Euro/Australian Dollar Chart
i) Market Structure.
ii) Trendlines
Market Structure
This can be referred to as "Price action", a pattern of movement of price in the market and the fundamental resistance and support levels on the price chart, swing highs as well as swing lows. These are easily identified levels on the price chart that captivates most interest and where trading positions like breakouts and stop-loss are based. It is a readable tool that traders can read and follow concerning the price movement which can be bullish, bearish, or range (which is in between). Ultimately, the market structure makes either bullish trend, bearish trend or is in range when it is in-between the bullish and bearish trend.
Market Structure (Bullish Trend):
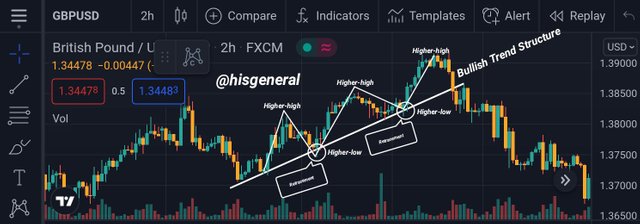
The bullish trend is characterized by higher-highs and higher-lows and the trend lingers in this direction until there is a formation of a lower-low, then the trend may experience a reversal and cease to form more higher-highs. For the bullish trend, there is a progressively consistent higher-highs and higher-lows as can be seen in the screenshot below:
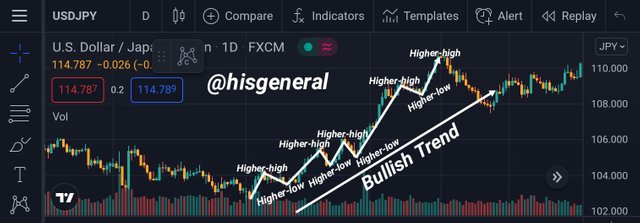
Bullish Trend: US Dollars/Japanese Yen Chart
Market Structure (Bearish Trend):
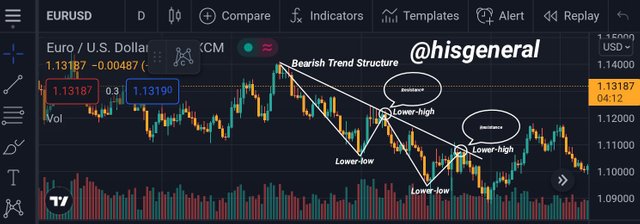
The bearish trend is the direct opposite of the bullish trend, as it is characterized by lower-highs and lower-lows. As long as there is the formation of lower-highs, the bearish trend will continue in its decline direction. A reversal of trend would be expected when there is a formation of equal lows or higher-lows.
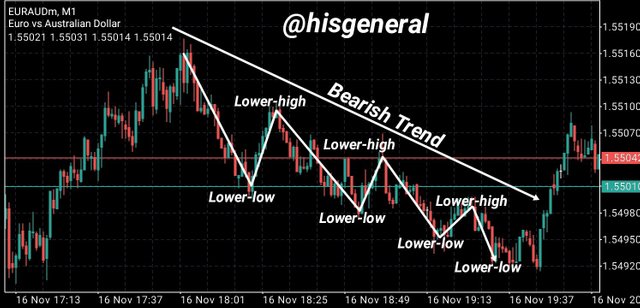
Bearish Trend: Euro/Australian Dollar Chart
Trend Lines
Trend lines are technical analysis techniques used to gauge exit and entry positions of investment timing on a price chart. They are used along with the price charts and a variety of technical analysis charts or tools. A trend line is a tool used for spotting positive and negative trending charts, it is a line showing the movement of the price of an asset which is constructed when a slanted line is drawn connecting at least three pivot points of price. A trend line can be support trend line which is constituted when assets price declines and bounces back at a pivot that falls into line with a minimum of two prior support pivot points. Trend lines are usually at an angle right above or below the price and offer clues about the present trend and show when there is a change of trend.
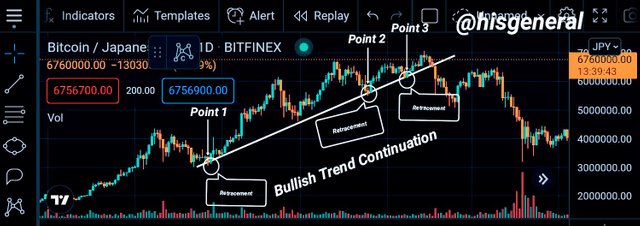
For the Bullish Trendline, the price of the coin pair is rising and is making progressive higher-highs and higher-lows. As can be seen in the chart below, the trendline seen below the price action engages three points of the higher-lows of the coin pair. At this, the trendline serves as a support.
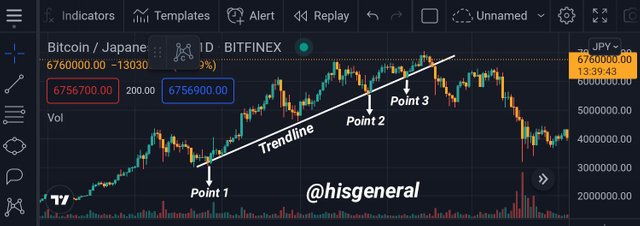
Bitcoin/Japanese Yen Chart
Bearish Trendlines
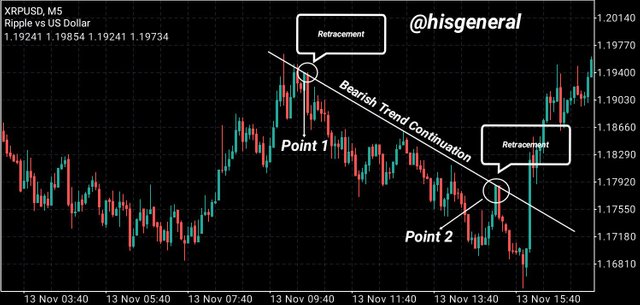
The bearish trend is seen to have a contrary image to the bullish trend. It is used to assess the price action during the decline of the price. When price makes lower-highs and lower-lows, it is said to be a bearish trend. The bearish trend as seen in the chart below is seen above the price action, unlike the bearish trendline, hence serving as resistance.
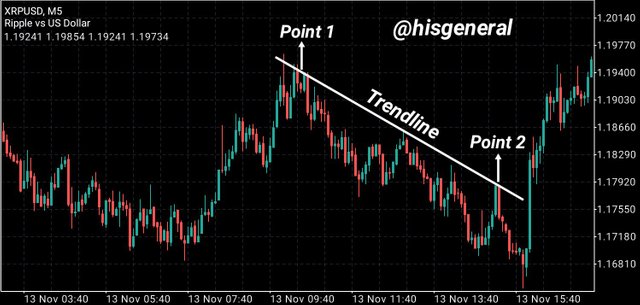
Ripple/US Dollars Chart
Trend Continuation
The movement of asset's price on a chart experiences retracement hence, this indicates a probable trend reversal from uptrend to a downtrend or vise versa, or perhaps the trend may continue in its trend. Investors' actions or that of the buyers and sellers can impact the trend which may result in discontinuation of trend or reversal. Investors can take advantage of this to make informed decisions. Trendlines and market structure can be utilized in determining or establishing that a trend will continue.
Spotting Trend Continuation Using Market Structure
As we well know that the activities of investors or buyers and sellers significantly contribute to the formation of structure on the price chart. A bullish trend is observed when there is a formation of higher-highs and high-lows and this is as a result of greater buying pressure as investor drives price and repurchase at any little decline of the price. Uptrend continuation is the result of this action.
Now going to the Bullish Trend, we observed the trendline drawn below the price and connecting at least point 2 points of the price. The trend will continue if the price goes up again after a retracement. There will be a trend reversal and the uptrend will no longer continue if the price breaks through the trend.
From the Bearish trend chart below, we see the trendline drawn right above the price serving as a resistance hence, the bearish trend will continue if the price keeps bouncing back after retracement and unless the price breaks through the trendline, the trend will go on.
Spotting Trend Continuation Using Trendline.
Trendline as have earlier explained is formed by drawing a line to connect a minimum of two or three points of the price candlestick chart either above as bearish trend or below as bullish trend. This trendline serves as resistance or support — also known as retracement — hence the price bounces back at this point on the trendline continuing its present trend which is referred to as the continuation of a trend.
Talking about the Bullish Trend, the trendline is drawn connecting two or more higher-low points of the price and each time the price reaches this point it bounces back and continues the uptrend movement. However, there will be a reversal of the trend if the price breaks through the trendline. Below is an example of an identified bullish trend with a trendline.
Bearish trend has its trendline drawn above the higher-low points of the chart and there is a continuation of the trend as the price keeps bouncing back after reaching the trend line or resistance. If the trendline is broken and the price rises above the trendline, then there will be a trend reversal and the downtrend will not continue.
i) Is the market trending?
ii) What is the current market trend? (Use the chart to back up your answers).
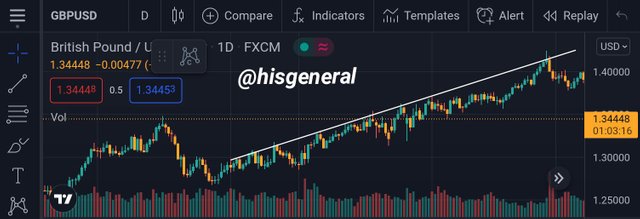
I will be attempting this question using the British Pound/US Dollars (GBP/USD) chart using TradingView app.
As can be observed from the chart, the market is trending as it is seen to be moving in a direction with some points of retracement
The asset in bullish trend — uptrend.
As long as trading is concerned, the trend is imperative. Whether a trader, investor big or small following and heeding to trend is advisable. Signals should always be taken into consideration before trading. Thanks to professor @reminiscence01 for the lesson.
Cc:.
@xkool24
Hello @hisgeneral, I’m glad you participated in the 1st week Season 5 of the Beginner’s class at the Steemit Crypto Academy. Your grades in this task are as follows:
Observations:
This is correct. Whenever the bullish trend starts experiencing lower lows then there may be a trend reversal.
Recommendation / Feedback:
Thank you for submitting your homework task.
Thank you prof for your review