Bichi Indicative Strategy- Steemit Crypto Academy- S5W6-Homework post for @utsavsaxena11.
Hey Steemit!
Here is my homework post for Professor @utsavsaxena11. It was a great lesson, and I hope you will enjoy reading my post.
.png)

1. Give a detailed analysis of BICHI STRATEGY. Starting from introduction, identification of trends, trend reversal in market, entry and exit from the market, one demo trade and finally, your opinion about this strategy. (Screenshot required).
This strategy is basically the combination of two indicators, Bollinger Bands and Ichimoku. The name of this strategy has been derived from the name of the two indicators that this strategy uses. The names of the indicators, Bollinger Bands and Ichimoku, when mixed, become BICHI, which is the name of this strategy. We can identify trends as well as trend reversal in the market; this enables us to take trades. Now, if we talk about trade, this strategy has a chance of 80 percent of getting the prediction right, which is very beneficial. On the other contrary, the disadvantage is that you have to wait for the cloud breakout to enter the market. Though, this cannot completely be considered as a disadvantage, as traders who have patience would consider it as an advantage.
By using the BICHI STRATEGY, we can identify both trends, uptrend and downtrend. Now let's talk about how to identify them one by one.
Identifying Uptrend using Bichi Strategy
The uptrend can be identified easily:
In order to use this strategy, Bollinger Bands must be acting as a support and resistance to the price action.
After that, wait until the price action breaks the Ichimoku cloud.
The middle line of Bollinger Bands must be acting as a support to the price action.
When these conditions meet, you will see an uptrend in the market.
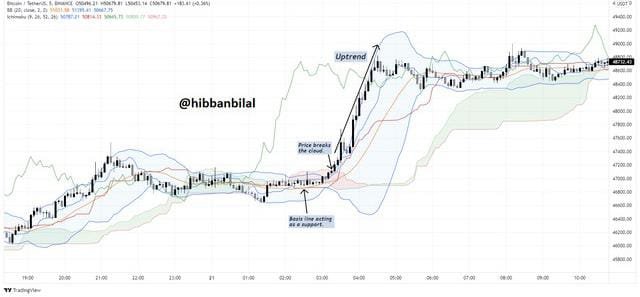
The chart above shows an uptrend in the price action. The basis line here acts as a support to the price. The price is seen to break the Ichimoku cloud. After that, an uptrend is witnessed.
Identifying Downtrend using Bichi Strategy
The identification of the downtrend is the inverse of the identification of the uptrend in the market using this strategy:
This condition is the same as for the identification of upper trend; the Bollinger Bands must be acting as a support and resistance to the price action.
Same goes for the second one, which is to wait until the price action breaks the Ichimoku cloud.
The middle line of Bollinger Bands must be acting as a resistance to the price action.
When the market follows these steps, a downtrend will be seen.
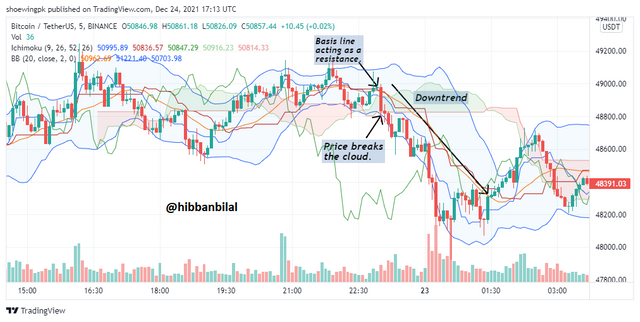
In the chart above, you can see the basis line act as a resistance to the price action. After that, the price broke the Ichimoku cloud, and we witnessed a downtrend.
BICHI STRATEGY can also be used to identify trend reversals in the market. Trend reversals can be identified from Bearish to Bullish as well as Bullish to Bearish by using this strategy.
Identifying Trend Reversal from Bearish to Bullish
In order to identify trend change from Bearish to Bullish, you need to notice the following movements in the market:
The price movement along with the Bollinger Band move down in a downtrend; this shows a bearish trend in the market.
After the downtrend, the market will be ranging, which means that it will travel in a sideway direction. During this movement, the price candles will break the Ichimoku clouds multiple times.
Once this movement ends, an uptrend will form in the market.
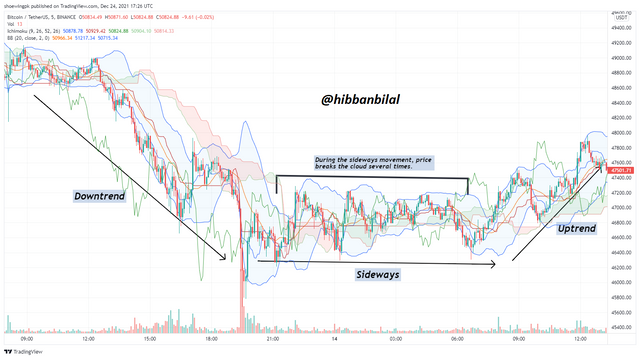
We can see a downtrend in the Bollinger bands and the price action in the chart above. After that, the market was ranging, and in between, the price cut the cloud several times. As the sideways movement ended, an uptrend was witnessed.
Identifying Trend Reversal from Bullish to Bearish
In order to identify trend change from Bullish to Bearish, you need to notice the following movements in the market:
The price movement along with the Bollinger Band move up in an uptrend; this shows a bullish trend in the market.
After the uptrend, the market will range, which means that it will travel in a sideway direction. During this movement, the price candles will be breaking the Ichimoku clouds multiple times.
Once this ranging movement ends, a downtrend will begin in the market.
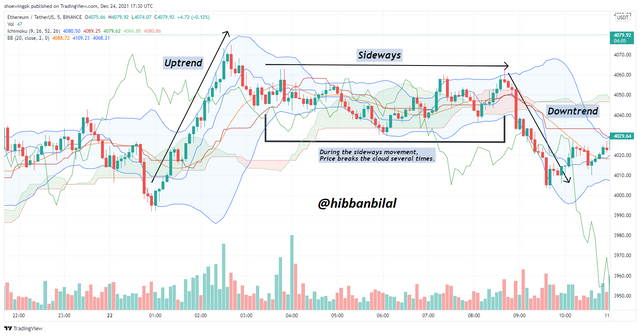
The chart above shows an uptrend in the Bollinger bands and the price action. After that, the market was moving sideways, and in between, the price cut the cloud several times. As this ranging movement of the market came to an end, a downtrend was witnessed.
Buying Trade
Entry and exit points of a buying trade can be identified using the BICHI STRATEGY, you need to use the following points:
First, we need to identify an uptrend in which the basis line is acting as a support to the price action.
After this, you need to wait for the price candle to cross the Ichimoku cloud.
Once the candle crosses the Ichimoku cloud, wait for the candle to close. Your entry point will be the next candle.
Stoploss will be placed at the point of the basis line, which is acting as a support to the price candlestick.
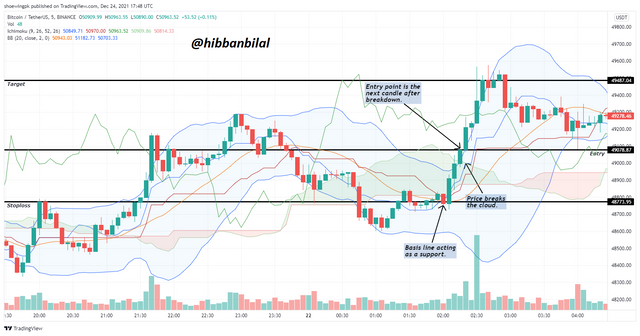
The chart shows the basis line acting as a support, and the price is seen to break the cloud. We marked the entry on the next candle after the breakout. We set our stop-loss on the point where the basis line was supporting the candle. We marked our target according to our risk to reward ratio. The entry, target and stop-loss levels are visible in the chart.
Selling Trade
Entry and exit points of a selling trade can be identified using the BICHI STRATEGY, you need to use the following points:
First, we need to identify a downtrend in which the basis line acts as a resistance to the price action.
After this, you need to wait until the price candle crosses the Ichimoku cloud.
Once the candle crosses the Ichimoku cloud, wait for the candle closure. Your entry point will be the next candle.
Stoploss will be placed at the point of the basis line, which acts as a resistance to the price candlesticks.
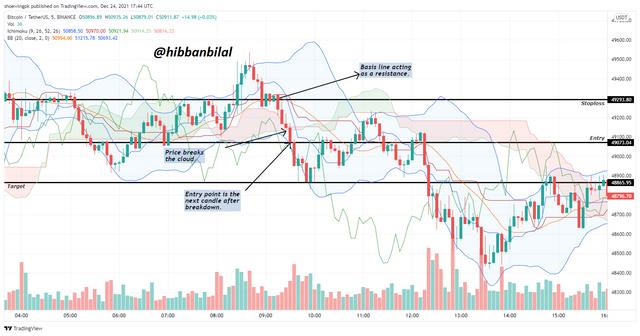
The chart shows that the basis line acts as a resistance to the price, and the price crosses the cloud. We enter the market on the next candle after the breakout. Our stop-loss is marked on the point where the basis line was resisting the candle. We marked our target according to our risk to reward ratio. The entry, target and stop-loss levels can be seen in the chart.
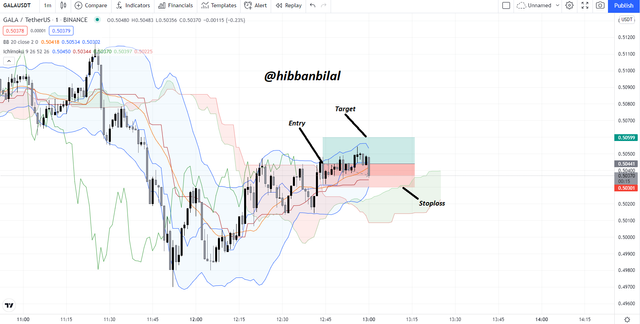
Below is the chart of GALAUSDT on a 1-minute timeframe. I noticed that the basis line of Bollinger Bands was below the price action. After that, the price candle broke the Ichimoku cloud. After the closure of that price candle, I entered the market. I set my target price according to the risk-reward ratio 1:1. I placed the stoploss at the support of the basis line.
My opinion about this strategy
This is a wonderful strategy to identify potential entry points in the market. The success chances of this strategy make it reliable and helpful. It can be used to take long as well as short trades and also to identify trends in the market. Overall, it is a very helpful and easy strategy. The fact that it is easy makes it usable by beginners too as well as advanced traders; therefore, it is a great strategy.
2. Define briefly Crypto IDX and Altcoins IDX. What is signal prediction trading. Is it legal or ill-legal in your country. (Explain briefly)
Crypto IDX
Crypto IDX, which stands for Cryptocurrency Index, is basically an asset. This asset is made by combining four currencies or by taking out the average of four currencies. These four currencies are Bitcoin, Ethereum, Litecoin and Zcash. Calculating Crypto IDX by yourself is very difficult due to its calculations; therefore, a platform Binomo is used to analyze this asset.
Altcoins IDX
Altcoins IDX, which stands for Altcoins Index, is an asset similar to Crypto IDX. Just like Crypto IDX, it is also formed by combining four cryptocurrencies. The cryptocurrencies that are involved are Ripple, Ethereum, Litecoin and Monero. The calculation of this asset is difficult, just like Crypto IDX, making it difficult to calculate it by yourself. Therefore, you can use the Binomo platform to analyze this asset.
Signal Prediction Trading
As the name suggests, in Signal Prediction Trading, you predict the movement of the price of an asset. Your success or loss depends on your prediction. You are not required to invest any money in buying the asset; rather, your money is invested in your prediction. If your prediction goes right, then you are in profit, but if it goes wrong, then you are at a loss.
Legal Ruling of Signal Prediction Trading in my Country
There is no legal ruling for Signal Prediction Trading in my Country. This means that it is not termed as legal, and it is not termed as illegal too.
3. If you want to create your own penny IDX, then which 4 penny assets will you choose and what is the reason behind choosing those four assets. Define Penny currencies.(Explain, no screenshot required).
Penny Currencies are those currencies that are worth less than a dollar. Therefore, if I want to create my own Penny IDX, the four penny assets that I will use must be less than a dollar each. The penny assets that I will use will be STEEM, SHIBA INU, TRX and VET. The reason that I chose these assets is that they have their use cases and have great potential in the future. SHIBA INU is now not just a meme token, but they are also making moves which makes it a good project in the future. In the coming years, these projects will be performing greatly. Also, three of these coins SHIBAINU, TRX and VET have good rankings on coinmarketcap.
The BITCHI STRATEGY, a combination of Bollinger Bands and Ichimoku clouds, is an easy and excellent way to get trade successes due to its success percentage. Though, we should always manage our risks to avoid huge losses. The strategy helps us to take buy and sell trades and also identify trend reversals. Crypto IDX and Altcoins IDX are indexes that are formed by the average of specific coins. It was a great lesson, and I thank Professor @utsavsaxena11 for giving us such an amazing lesson.
@steemcurator02
@steemcurator02
@steemcurator02
@steemcurator02