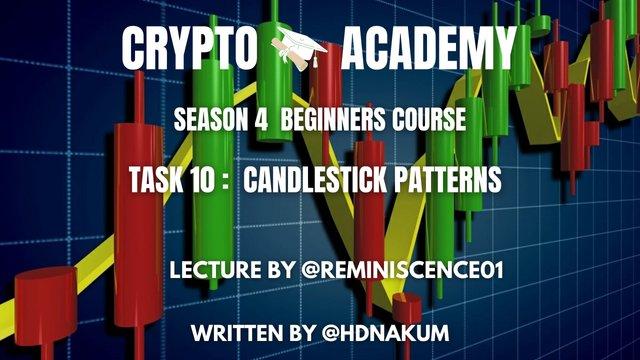
Candlestick Patterns by @hdnakum - Steemit Crypto Academy Season 4 - Homework Post for Task 10
Hey Steemians,
Good afternoon to everyone,
Greeting to #steemitcrytoacademy -The learning community on the steemit platform.
Hello guys I'm @hdnakum. and im presenting you a last but not least Homework9 today. This is the last beginner's Homework task 10 that im going to complete today from my side. I have enjoyed a lot reading every homework task be it Homework 1, 2, 6, 9 by @sapwood, or Homework 3, 4, 5, 7, 8 and 10 by @awesononso @yousafharoonkhan and @stream4u, @imagen, @wahyunahrul and @reminiscence01, respectively.
In this homework 10, @reminiscence01 has discussed all types of candlestick patterns, and the psychology behind forming such candles. I have never learned about such things earlier because I have never done trading but after reading this homework, I will dare to put some money for trading as well. There are three questions asked by professor @reminiscence01 and attendance of one question is mandatory. I will try to answer the first question by breaking it into three smaller questions.

MAIN QUESTION:
- 1(a) Explain the Japanese candlestick chart? (Original screenshot required).
(b) In your own words, explain why the Japanese Candlestick chart is the most used in the financial market.
(c) Describe a bullish and bearish candle. Also, explain its anatomy. (Original screenshot required).
Question 1
Explain the Japanese candlestick chart?
Since 1700, everything in the world has changed dramatically but one thing that remains constant, most widely adopted and accepted by every trader of any county is the Japanese candlestick model invented by a rice merchant Homma Munehisa. We all know that market movement can not be predicted by any kind of pattern be it candlestick, or bar chart or simple line chart.
The main goal of Homma Munehisa behind inventing the candlestick patterns is to understand the sentiment of buyers or sellers at a time. Believe me, you can't predict the future of the market otherwise you would have been a billionaire by now, not reading this shitty post. There are various ways to show you a market condition by the candlestick, bar and line chart, however, the candlestick pattern is more informative than the rest of the two.
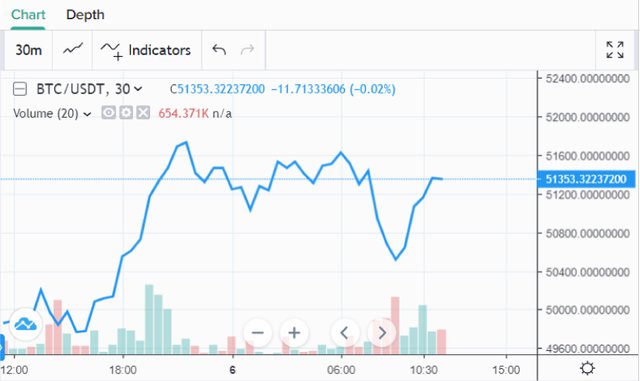
From the above line pattern, one can not predict what is the sentiment of buyers and sellers now, whereas, from the candlestick pattern, a learned guy can predict (may be right or wrong) the sentiment of the market for the short term. Due to easiness in reading the sentiment of the market, the Japanese candlestick pattern is most widely used by cryptocurrency, commodity and stock traders all over the world.
In the case of Candlestick patterns, one can understand the sentiment of buyers and sellers. The Candlestick is made up of a total of four parts that show behaviours of the asset price. The four-part are
- OPEN
- HIGH
- CLOSE
- LOW
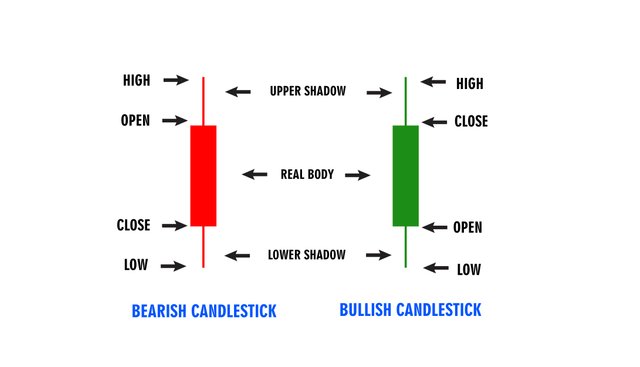
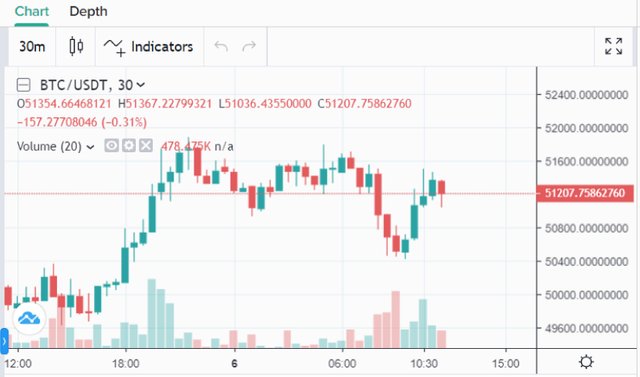
You can see that candlestick patterns are shown in two colours one is Green and another is Red. The green candlestick represents bullish moves which are usually formed when the buyers are dominating the market. In the case of Red candlestick, known as bearish candlestick, sellers are in the driving seat. It is all about the Supply and demand game.
In short, Higher the supply of any assets, demand will be low, thus the price will move downwards (bearish - Red candle), whereas, high demand drives the price of the market upwards (Bullish - Green candle).
Question 2
In your own words, explain why the Japanese Candlestick chart is the most used in the financial market?.
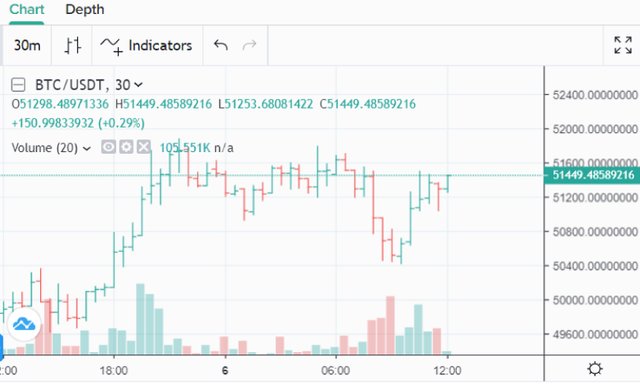
From the above images, you can easily say that candlestick patterns look more convenient or quite readable and understandable than the other two Bar charts and line charts. Candlestick patterns are studied extensively and some of the recurring patterns can help any trader to predict the potential next move of the market. Traders keep charting to get any possible hints from candlestick patterns to bet tonnes of money. That's why it is used by most of the financial market be it cryptocurrency, stockmarket, Gold or commodity market. By doing the technical analysis, the candlestick pattern gives a detailed representation of price change.
- Help to understand Market Trend
When you see candlestick patterns for any asset, you will be able to find out market trends easily. The colours of candlesticks is a prime tool help traders determine market movement. The avid trader can easily find the bullish, bearish by the formation of different types of well-known patterns such as Engulfing, Doji, Hammer, the morning and evening star.
Help to understand the emotion of buyers and sellers
We all know that the candlestick pattern formed just because there is a game of supply and demand working behind it. The formation of the Green candlestick for any asset says that the buyers are optimistic about the product than sellers. In the case of the appearance of the red candlestick, buyers are not optimistic about the asset and sellers are selling thier asset, which causes bearish patterns.Easy to read and learn
The candlestick patterns are very easy to understand than both Bar and line charts. Any newbie can learn types of candlestick patterns forms generally by reading some blogs or just watching a quality tutorial available whereas there is very little availability of learning bar and line charts.
- Quite reliable informative patterns
Candlestick has specific colours and shapes. The body size of the candlestick pattern also gives an idea about the volume of particular assets. Thus, from the candlestick patterns, traders can have an idea of how much people are buying and selling by just looking at candlestick patterns.
So, in short, the Candlestick pattern provides lots of information (bearish, bullish, market sentiment, volume) by just looking at it whereas, the bar and line chart does not stand even close to candlestick patterns in terms of understanding market movements.

Question 3
Describe a bullish and bearish candle. Also, explain its anatomy. (Original screenshot required).
1) Bullish Candlestick
As we have discussed above, in question 1, there are mainly two types of candlestick patterns, one is Bullish and another is Bearish pattern. As we know that, bullish candlestick forms when there is less supply and high demand of any asset (buyers are optimistic about the asset). The less supply and high demand cause the asset price to skyrocket by forming strong bullish patterns.
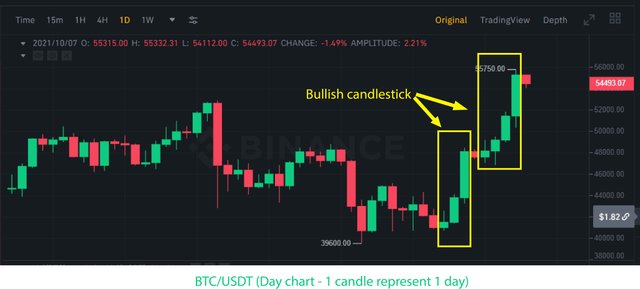
As shown below, I have highlighted how the bullish candle looks like. The below chart is one day chart in which one candle represents one day. Yellow boxes in the below image say bitcoin was bullish on 29/9, 30/9, 1, 2, 3,4, 5, 6/10/2021.
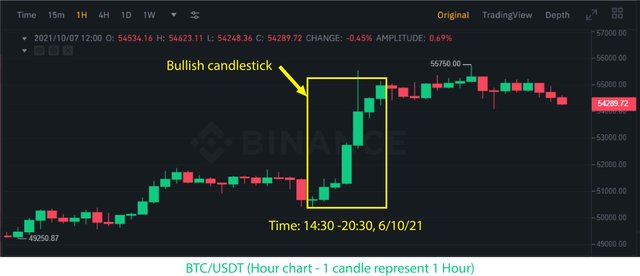
If we look at the hourly candlestick chart of 06/10/21, from 14:30 hrs to 22:30 hrs, the bitcoin was strongly bullish and reach 50k to 55k USDT. Bullish candlestick means buyers are so optimistic about BTC price to reach ATH.
- Anatomy of a Bullish Candlestick
As we have discussed above, each candle has a total of four parts and each part represents a different price at a given time. Two more parts Body and shadow are also quite important while talking about candlestick patterns.
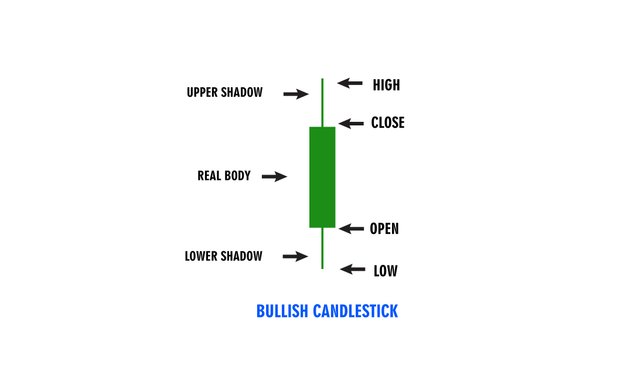
HIGH:
This is the highest point/price of any candle within a specific period. In a bullish candle, if High is above the close, people are buying the asset more and indicate buying pressure which moves the market upwards.CLOSE:
This is the last price of the candle and the price represent the end of the particular candlestick pattern. It can be called a closing price as well.
- OPEN:
This is the opening price of an asset where the price movement starts. The movement of price will form a body of the candlestick. A bearish candlestick always opens higher than a bullish candle. It can also know as the opening price of the asset.
- LOW:
This is the lowest price point that reaches during a specific period. If you find the low is below an open price, it indicates that the price opened at a high price but selling pressure leads it to lower. however, buying pressure moved the market upwards later.
The other two parts that are formed as an interaction between these four points are the body and shadow.
- BODY:
The part between the close and open price is known as a body in candlestick patterns. The bigger is the body, the more volume of particular assets are being traded.
- SHADOW:
The shadow is the part of the candlestick which is between Low and closing or High and opening price. Sometimes it is also known as the wick of the candle. Bigger is the wick or shadow, more is the uncertainty in the movement of the market.
2) Bearish Candlestick
As we have discussed above, in question 1, bearish candlestick forms when there is more supply and less demand of any asset (buyers are not optimistic about the asset). The high supply and less demand cause the selling pressure on the market which then forms strong bearish candlestick patterns.
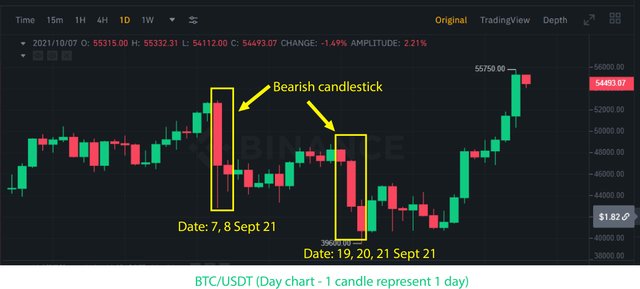
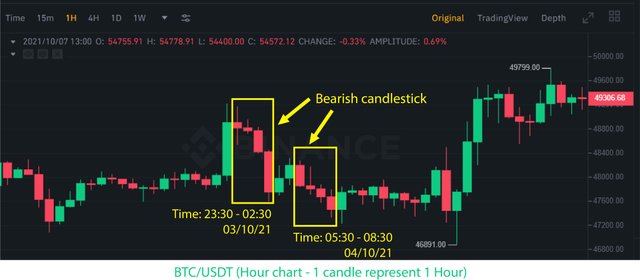
As shown below, I have highlighted how the bearish candle. The below chart is one Hour chart in which one candle represents one hour. Yellow boxes in the below image say bitcoin was bearish at the specified time.
- Anatomy of a Bearish Candlestick
As we have discussed above, each bearish candle has also a total of four parts and each part represents a different price at a given time.
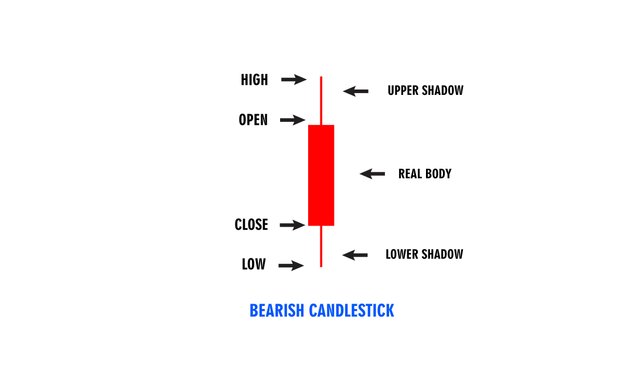
- HIGH:
This is the highest point of any candle within a specified time. In a bearish candlestick, if High is above the open, people are buying the asset more and then suddenly selling pressure is created which turns the entire candle bearish.
OPEN:
This is the beginning or opening price of an asset where the price fluctuation just starts. The movement of price will form a body of the candlestick. In general, a bearish candlestick always opens higher than a bullish candle. It can also know as the opening price of the asset.CLOSE:
This is the last price of the candle and the price represent the end of the particular candlestick pattern. It can be called a closing price of the asset for a particular period.
- LOW:
This is the lowest price of the asset that reaches during a specific period. If you find the low is below the closing price, it indicates that the price opened at a high but then selling pressure leads it to lower.
Conclusion
In the last homework 10, professor @reminiscence01 did an amazing job by introducing various types of candlestick pattern formation in the market. I would like to thank him for his amazing piece of work because I was feeling so bored whenever I tried to understand the candlestick patterns from tutorials or blogs. i found it easy now after finishing this homework 10. I am happy that I have finished all the 10 homework within a month and learn a lot as well. Thank you to all the professors.


You question is great in which we should know the business but to get profit, we have to go by looking at the data but sometimes there can be loss also you can guess from market chart and do your business well it's on trader depends. thanks for sharing @hdnakum