Understanding Trends II - Steemit Crypto Academy / S5W3- Homework Post for @reminiscence01
Image designed on Pixellab
My first post on this week's lecture for Beginers courses in the cryptoacademy community, and also a continuation of previous lecture assignment under the topic of understanding trends, this being understanding it's reversals.

1a Explain your understanding of trend reversal. What is the benefit of identifying reversal pattern in the market?
INTRODUCTION
Trends referred to as continuously moving in a certain direction or aggravating towards a certain pattern.
As we know market price is subject to change and monitoring those changes and in what direction is what is called a trending market.
Market price could follow a pattern price for a while and suddenly take another turn after another while, this is why every trader is always advised to do research into the crypto asset they're investing in because the cryptocurrency market is very volatile.
This is what brings us to the study of reversals. To reverse is to also change direction but only after a continuous movement towards a specific pattern.
Equating this to the study of trends in the trending market we see that market price following a certain pattern over a time period could deviate and make a change in the initial direction.
Understanding why there is such a change, monitoring signs that indicates such a change is about to occur and knowing how to take advantage of them in application to trading is why we study Trends and trend reversals.
Reversal in trends are not so much abrupt because there can be indicators in the pattern that give an idea of a trend reversal about to happen.
As a trader it is useful to understand that the price will not follow one pattern of movement and to study when there is a change so as to take profit at the right time and exit before encountering a loss.
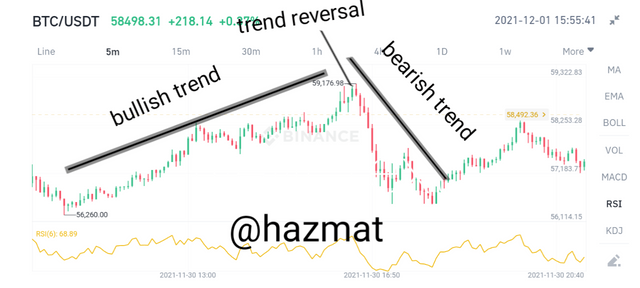
Just as there are two main changes in the market price, the upward price change known as the bullish and the downward price change called the Bearish. The same is seen when we talk about trend reversals.
•Bullish trend reversal
For a reversal in trend during a Bullish period we see an upward movement of the price pattern but at a point buyers could not sustain the control of the market and a deviation or a reversal is then witnessed.
•Bearish trend reversal
The same is applicable when the trend shows a bearish pattern in price movement, it gets to a point where the sellers are not able to control the price and then a reversal in the trend from the bearish is seen.
Understanding of reversals in trends just like understanding of trends cannot be said to be a 100% safe or accurate analysis, so it is always advisable to potential traders to also do research alongside using other technical indicators.
BENEFITS OF IDENTIFYING REVERSAL PATTERNS
| BENEFIT | MEANING |
|---|---|
| PROFIT | Serves as a useful indicator on when to take profit before trader begins to Incur loss due to price change. |
| MAKING DECISION | It is very useful in deciding point of entry and exit for a trader either buying or selling. |
| MARKET PROJECTIONS | Studying them serves as a source of data analysis for making market projection that are of advantage to the trader. |
All images are sourced from my Binance account
1b How can a fake reversal signal be avoided in the market?
It has always been advisable to potential traders that because of the volatility of the crypto market, make proper investigation into the asset you want to put funds.
One of those avoidable mistake is avoiding a fake reversal signal.
A trader is not expected to make decisions based on one trading indicator or strategy, but but by using one or more.
An example is when studying the price patterns of the trends, you make analysis using other technical indicators alongside because study of trends alone isn't a perfect analysis.
Some indicators are only advantageous up to an extent, but by combining them a better and more detailed analysis can be made there by increasing the chance of spotting a fake reversal signal and avoiding it.
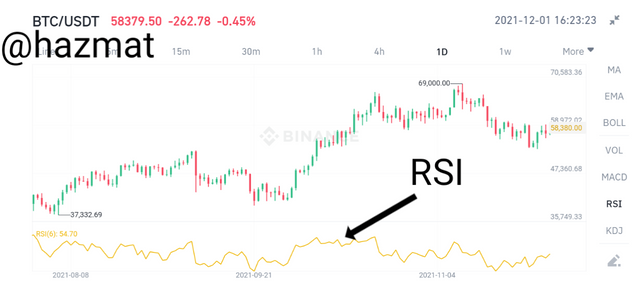
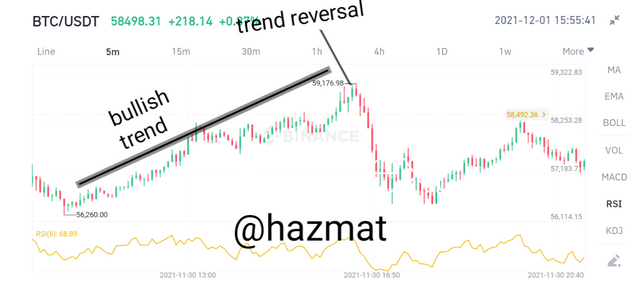
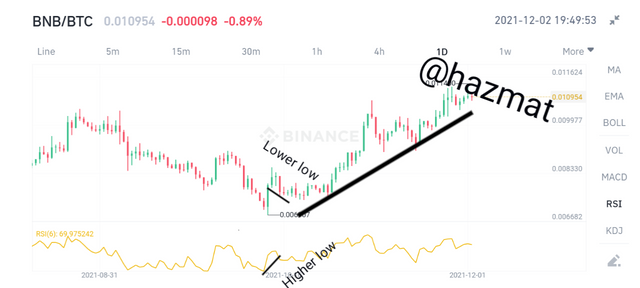
Image above shows studying of the trends whilst using the RSI indicator alongside it.
All images are sourced from my Binance account
2 Give a detailed explanation on the following Trend reversal identification and back up your explanation using your original chart
BREAK OF MARKET STRUCTURE
The structure of the market and the pattern of conditions in which it is in, to a large extent plays a key decision on whether a trader will invest or not.
As earlier stated the cryptocurrency market is one with a lot of volatility. With highs and lows recorded there will always be fluctuations in the price value and so we tend to see a break in the pattern from one price movement to another.
Trends such as the bullish trend and bearish trend are not fixed conditions and are constantly changing bringing about a change in the market structure.
Such a break is evident in reversals which brings about a bullish trend reversal and a bearish trend reversal.
•Bullish trend reversal
This is a situation which occurs during an upward movement in the price of the market otherwise called uptrend.
It is established that for the bullish trend to continue the high formed must be above the previously formed one, and the low must be higher than it's predecessor. By doing this the bullish trend continues.
This upward movement shows strength of the buyers in controlling market price, but when this control isn't sustained we begin to see a change or reversal in the price movement.
Such a reversal means that there is a break in the bullish trend and market structure has been reversed from upward to downward.
•Bearish trend reversal
This reversal is an opposite of the bullish because here the price movement is initially at a downward pattern, signifying that the sellers control the market price.
The new low which is formed must be lower than the predecessor, while the high must also be lower than the previously formed high. This ensures that the trend continues, but when this doesn't occur then a change in price movement will start to occur.
At the point where controls begins to wane, we see a shift in trend pattern from the downward movement to an upward one.
BREAK OF TRENDLINE
The trendline is a line drawn to monitor the pattern of price direction of the market.
The trend is valid as long as the trendline does not cut across the trend pattern, if this happens we notice a break in the trend.
By breaking the trend the trader is aware of a possible reversal in the trend which the price had been following. This is applicable for both bullish as well as the bearish trend.
For a Bullish trend, the trendline is drawn under the trend pattern serving as a source of support, the trend will continue as long as the price movement is not broken by the trendline.
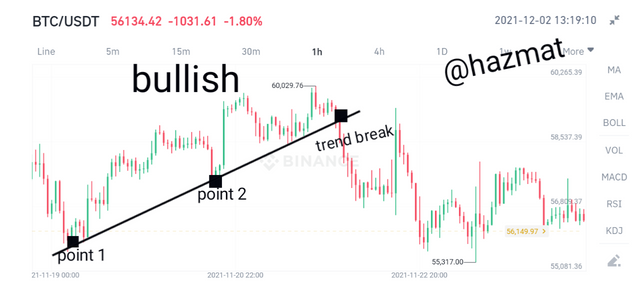
When the trendline no longer supports the price movement, we notice the trendline breaking through and a reversal in the bullish trend.
For the bearish trend, it is noted that the trendline is drawn above the downward price change serving as a source of resistance. As long as the resistance is maintained, the trend continues.
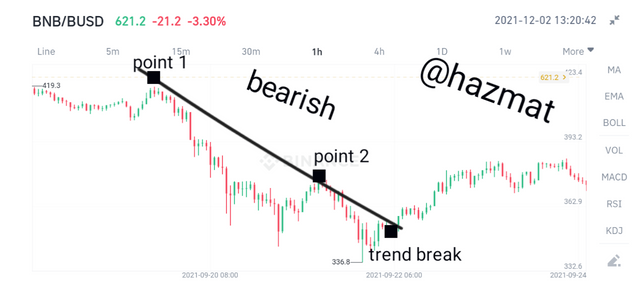
When the price pattern breaks through the trendline we say there is a break in trend and we can see a reversal from the bearish trend.
DIVERGENCE
A divergence is usually a contradictory result between two bodies. This is. phenomenon in the cryptocurrency market where the movement in price pattern and that of the technical indicator do not conform.
There is a contradiction in the trend of the price and that of the indicator with one showing a Bullish trend and the other a bearish trend or vice versa.
•Bullish divergence
This divergence or contradiction is evident when the price movement is in a bearish pattern but the indicator shows a Bullish movement.
This lack of conformity is a signal that a reversal in trend might be due and sellers should make exit as market could soon be in control of buyers.
•Bearish divergence
The Bearish divergence is seen when the market price pattern follows an upward or bullish movement while the indicator shows a downward or bearish movement.
This is an indication of a reversal in trend pattern from the bullish to bearish indicating loss of control amongst buyers.
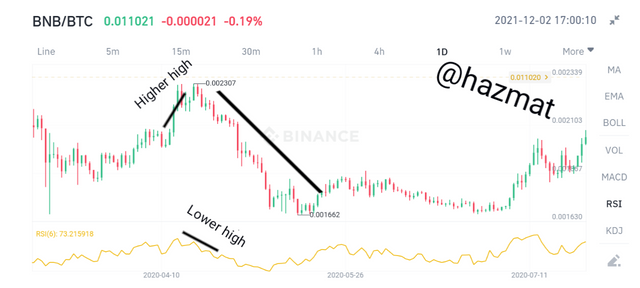
A trader would do well to make exit as a buyer and prepare for a sell option.
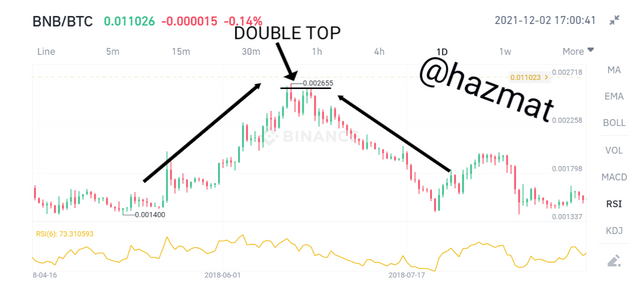
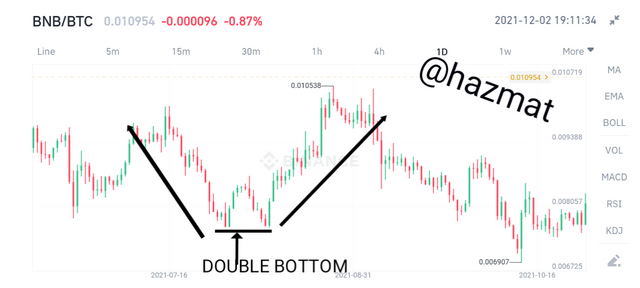
DOUBLE TOP AND DOUBLE BOTTOM
Double top and double bottom are formed during the bullish and bearish trend respectively.
This occurs when the buyers in the case of a Bullish trend or the sellers in the case of a Bearish trend are not able to continue driving up or driving down the price.
For a double top during the bullish trend, the new high which is formed fails to go higher than the previously formed high, indicating inability of buyers to drive up the price predicting a subsequent loss in control and reversal.
For the Double bottom during the bearish trend, the new low which is formed also fails to go lower than its predecessor, a reversal in trend and loss of control of market from the sellers is expected since they failed to drive down the price.
All images are sourced from my Binance account
3 Place a demo trade using any crypto trading platform and enter a buy or sell position using any of the above mentioned trend reversal or continuation patterns
TREND REVERSAL USING BREAK OF MARKET STRUCTURE
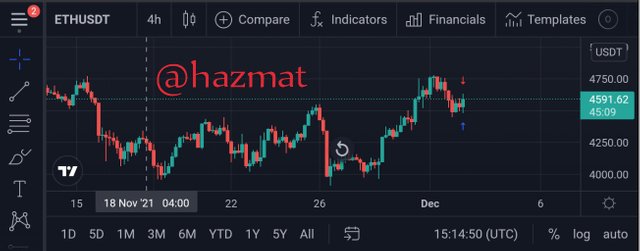
From image above we see that trend began a reversal at price 4591. So I'm made a buy entry expecting a bullish trend.
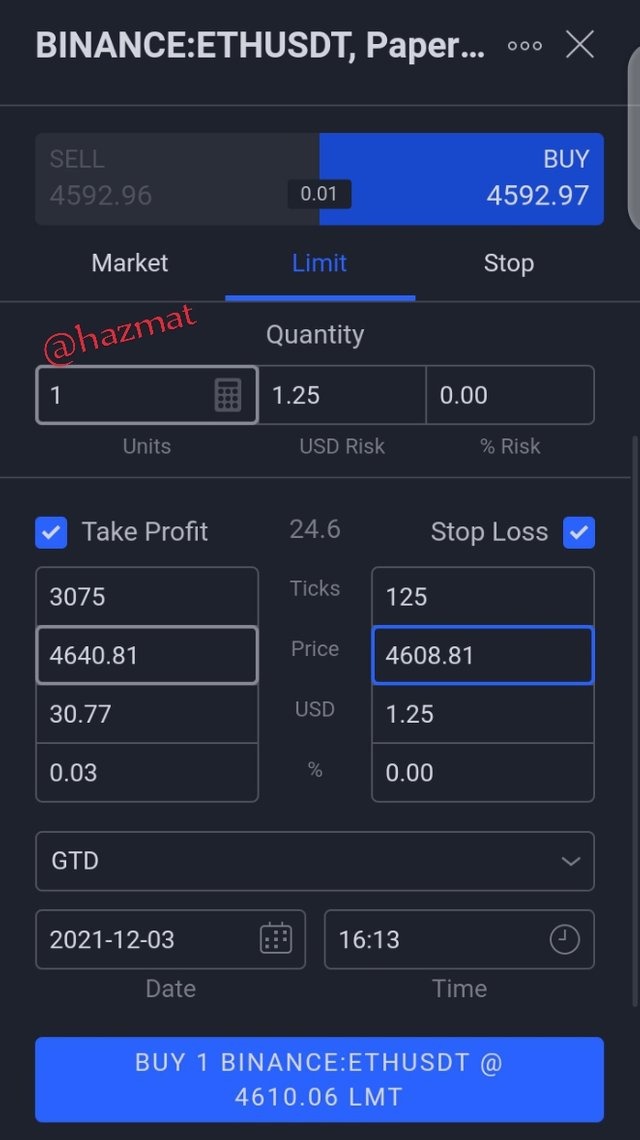
I made buy entry at 4592.97 , hoping for a Bullish I made a take profit point at 4640.81 which is higher than my buy entry point.
But if trend pattern doesn't follow my prediction I made a sell to stop loss at 4608.81.
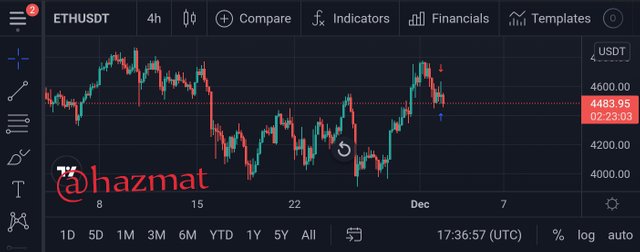
The stop loss at 4608.81 was activated as bullish trend didn't form.
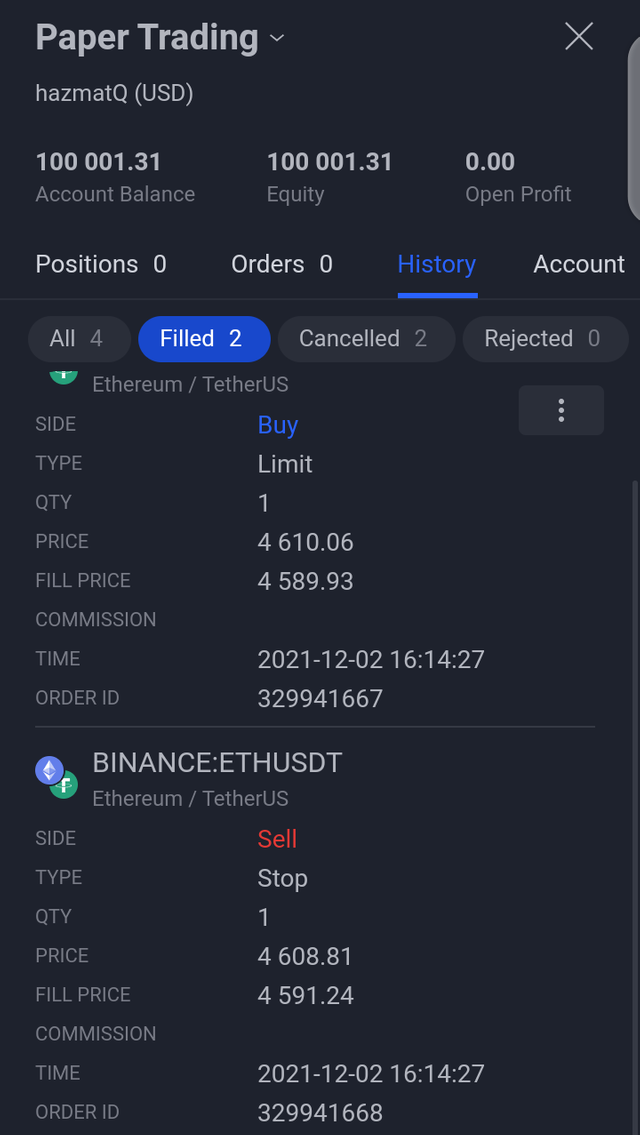
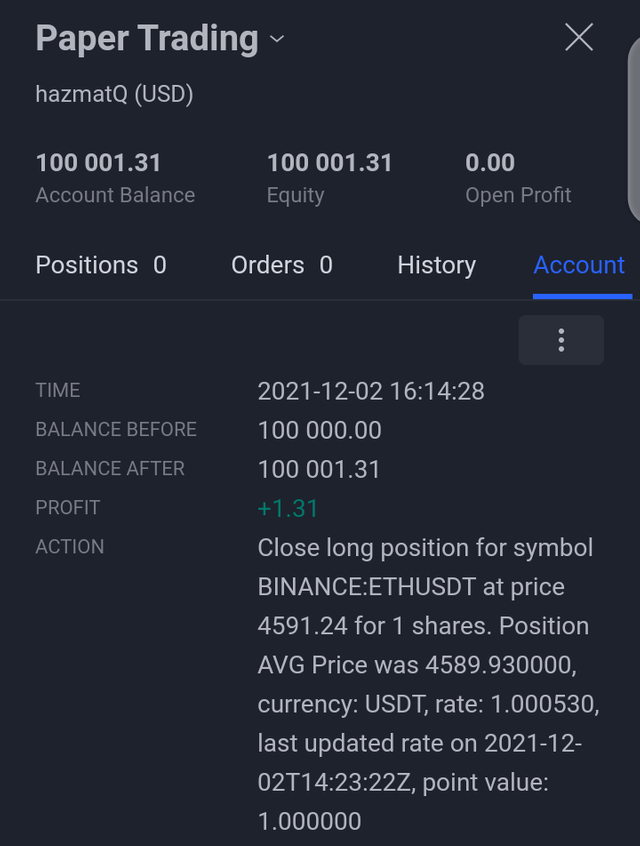
Profit taken before any loss was incurred.
Images used are sourced from tradingview site
CONCLUSION
The demo trade above was done using information from just the trend pattern causing a fake reversal signal.
I do not understand how to use additional technical indicators very well and I will do more research on that.
This shows that understanding trends alone is not a perfect analysis and does not provide perfect Information. It is necessary as a trader to do extensive research and use other trading indicators and strategies.
This is a very much enjoyed assignment post I partook in and also a detailed lecture from the professor.
I look forward to your review of my work professor @reminiscence01.
Hello @hazmat , I’m glad you participated in the 3rd week Season 5 of the Beginner’s class at the Steemit Crypto Academy. Your grades in this task are as follows:
Observations:
This is not correct for a bullish trend reversal.
Recommendation / Feedback:
Thank you for submitting your homework task.