UNDERSTANDING TRENDS :Crypto Academy / S5W1- Homework Post for @reminiscence01
This is my first post for the first week of season 5, on the topic of how we can understand and use the trends for making analysis on trades
Image designed on Pixellab

1a What do you understand by a Trending market?
INTRODUCTION
The crypto market as we know it is one that can be very volatile, a lot of highs and lows are usually recorded.
.jpeg)
As a potential trader or an already existing one it is very important to be able to follow the market and make good predictions on the direction of the market.
Ability to know when to buy or sell can be very advantageous to a trader thus, it is pertinent to study some of the key tools that can be used to do so. One of such is monitoring what we know as trends.
Before going into details about trending market it is pertinent to lay down an understanding of what is meant by trends and trending market.
TREND
To trend is to continuously move in a certain direction or you can say something is aggravating towards a certain pattern.
Such changes are usually for a time period and can either have a positive or a negative effect.
TRENDING MARKET
A trending market can now safely be called a market where the price change is generally in a particular direction for a time period.
.png)
It is important to note that slight changes still occur along the pattern but the overall outlook of the price for that frame of time is usually in a single direction.
Although this is not a perfect analysis of where future market will be, they give an inkling of what to possibly expect. Potential traders would do well to study these trends whether upward or downward and act accordingly.
A market can be bullish which is an upward price rise and it could also be bearish which is a downward movement of the price value.
IMPORTANCE OF STUDYING TRENDING MARKET
| IMPORTANCE | MEANING |
|---|---|
| PROJECTION | Studying the trending market and analyzing it's data can serve as a source of comparison for future trades and projections of the market which can be advantageous to the trader. |
| OPPORTUNITIES | Trends can serve as a means of identification for which market has the best opportunities and the ones to beat avoid. |
| DECISION MAKING | Trends help improve better decision making, when to invest in a market and when to exit one. You have the advantage of not just trading blindly. |
b What is meant by a bullish trend and a bearish trend?
One of the most important factors to consider when entering a market is the price and it could either be positive or a negative outcome.
Two terms which have become quite popular in market are bullish and bearish which signify high or low price changes.
As mentioned earlier trends depict movement in a direction, relating this to market bring us what is called the bullish trend and the bearish trend.
BULLISH TREND
Bullish trends can be depicted as a pattern of upward movement in the price of the market.
A lot times we hear traders say the market is in a bullish period, what is meant is that trading price continues to form an upward pattern, and for the periods it comes downward it doesn't go below the previously recorded upward price.
Such an upward recorded price is known as a higher high and the downward price is called a higher low.
Although the higher low shows a slight drop in price for brief moments, this cannot be sustained and is evident in the overall outlook of the price for that period. The pattern continues to go up.
A bullish trend helps to understand that for that time period buyers are in control of the market.
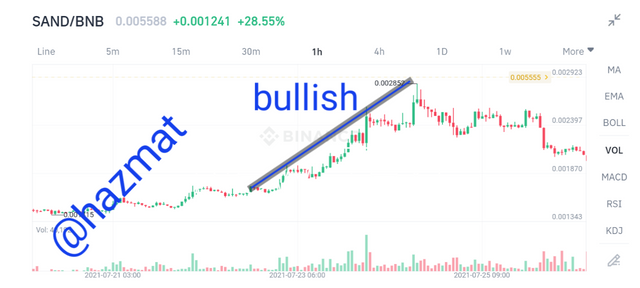
Image designed on Pixellab
BEARISH TREND
The bearish trend is exactly the complete opposite of the bullish trend, here the pattern is a downward price movement in the market.
The trading prices form a downward pattern called a lower low and the moments where price fluctuate upward the price does not go below the lower point previously reached.
The Longview of the pattern will also show that price continued to decrease in a downward trend just as it formed as an upward one when the market was bullish.
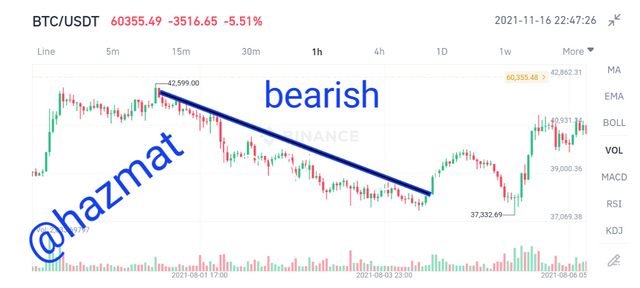
Image designed on Pixellab
All images used are sourced from my Binance account
2 Explain the following trend identification and give an example of each of them. (Original screenshot needed from your chart). Do this for a bullish and a bearish trend.
i) Market Structure.
ii) Trendlines
•MARKET STRUCTURE
The structure of the market is a tell on the kind of condition it is in. Analysis of the market structure can be done by studying the data from the pattern of price as it varies in relation to buying and selling.
From basic economics we know that when there is large demand for something compared to the supply available, the price increases. Likewise when the demand is lower but the supply is much then the price decreases.
Studying all of this variation as price changes, why it is changing, and for how long it changes helps to understand the way the market is structured.
Two major that always come up are what we call the trend and ranging phases. The trending phaes involve the upward trend and the downward trend.
As earlier mentioned, the upward trend is what we also call the bullish trend, evident in the upward pattern which the price follows. The downward trend as well is known as the bearish trend, and it is also evident in the downward pattern followed by the price.
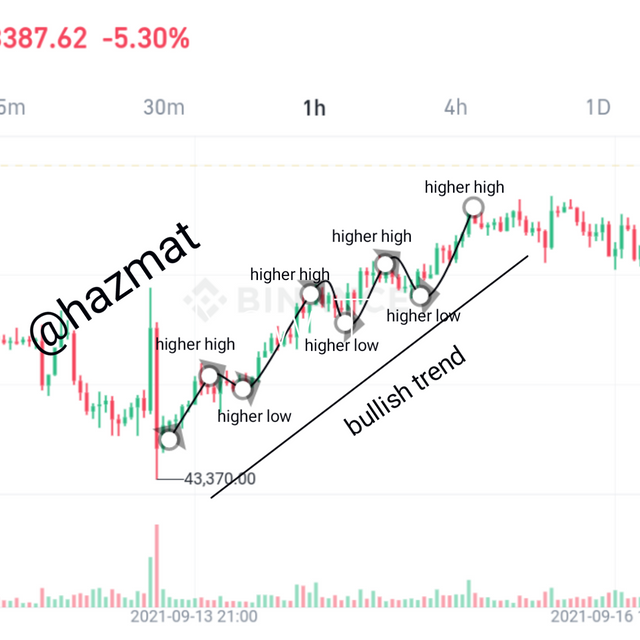
Image designed on Pixellab
As depicted above the bullish trend is in an upward pattern with higher high formed and the times price dropped a higher low is formed which does not go below the previous higher high.
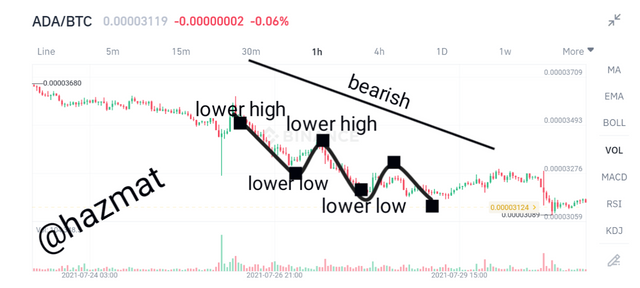
Image designed on Pixellab
As can also be seen above the trend here is sloping downward showing that price continued to decrease. A lower low is formed and when price increases a lower high is formed but it does not go above the previous lower low.
•TRENDLINES
The trend lines is another type of analytical tool which is used by traders.
A trendline can be bullish and can also be Bearish. A trendline showing a bullish trend is also known as an uptrend, here the line is drawn at two low points to show the trendline movement.
For a bearish trend the trendline is a downtrend, here the line is drawn at two high points to show the movement of the line.
•BULLISH LINE TRENDLINE
The trendline for the bullish trend can be seen at the bottom. At any point when the price touches the line, it goes back up serving a role of support.
Buyers enter the market at the point as price does not go below the line unless the trend is broken.
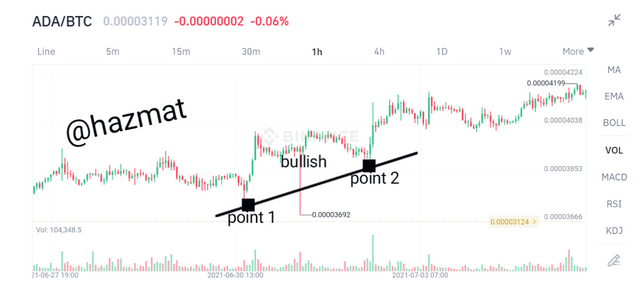
Image designed on Pixellab
•BEARISH TREND TRENDLINE
Just as the trendline is upward for bullish, the trendline for a bearish trend is downward with two high points.
Here the trendline serves a role of resistance of the price whenever it touches the line.
At this point the price does not go above the trendline unless the trend is also broken.
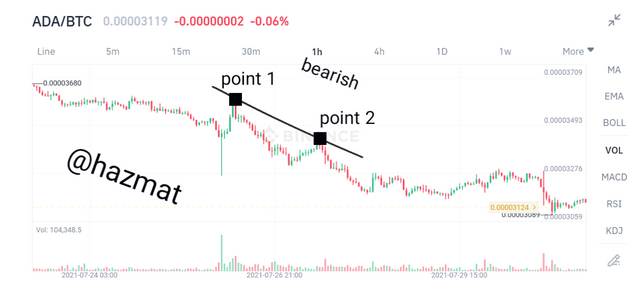
Image designed on Pixellab
All images used are sourced from my Binance account
3 Explain trend continuation and how to spot them using market structure and trendlines. (Screenshot needed).
Trend continuation is one of the key things traders try to spot to know whether a trend will continue or break.
Due to the fact that the price change varies and can move upward or downward, trend continuation helps to monitor whether the price fluctuations continue to follow the same pattern.
Buyers and sellers take advantage of this as they can buy at a low price and sell when the price has increased.
Market Structure
For the market structure, we can monitor the trend continuation for both the bullish trend and the bearish trend.
•TREND CONTINUATION FOR BULLISH TREND
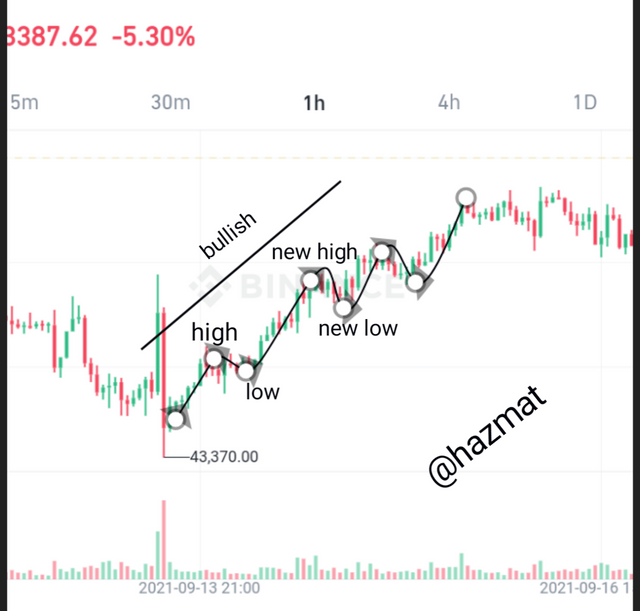
For a bullish trend the trend continuation is subject to two factors.
Firstly the new high formed must be at a higher level than the previously recorded high, and also the new low recorded must also be higher than the previously formed low.
Doing this, the continuation of the trend can be ensured.
Trend continuation for bullish trend
•TREND CONTINUATION FOR BEARISH TREND
The trend continuation for a bearish trend is also dependent on two factors.
Firstly the new high formed must be at a lower lower than the previously formed high, also the new low must be at a lower level than the previously formed low.
This will ensure the continuation of the trend for a bearish trend
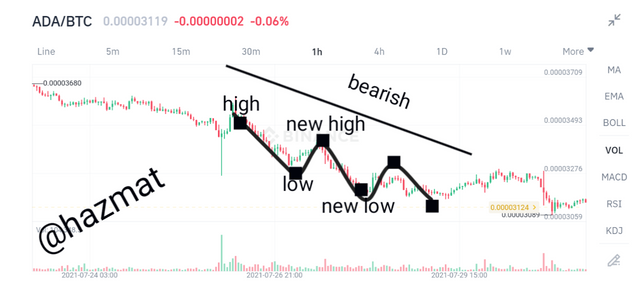
Image designed on Pixellab
Trendline
For a trendline, the trend continuation can also be monitored for a Bullish trend as well as a Bearish trend.
•Bullish Trend
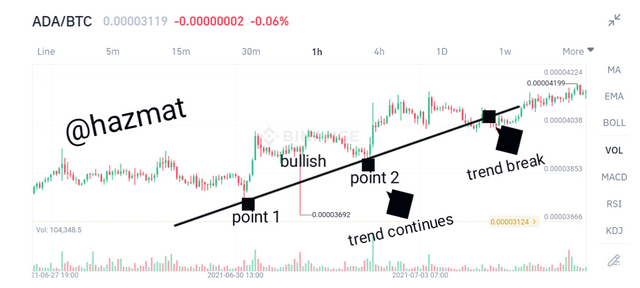
Image designed on Pixellab
At the point where the price pattern hits the trend line initially it goes up signifying that the trend is in continuation, but when the pattern crosses the trendline the trend breaks.
•Bearish Trend
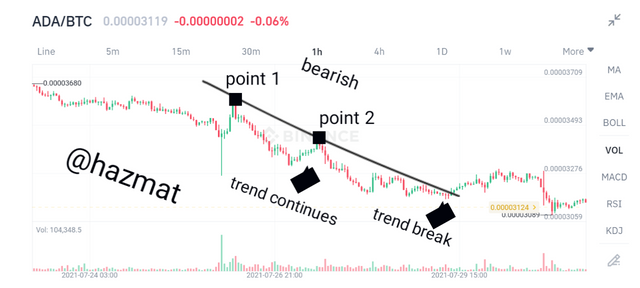
Image designed on Pixellab
For bearish it is the same as bullish, as long as price does not cross the trendline there is a trend continuation here too.
But when the price breaks the trendline, the trend ends.
All images used are sourced from my Binance account
4 Pick up any crypto-asset chart and answer the following questions.
i) Is the market trending?
ii) What is the current market trend? (Use the chart to back up your answers).
This is a one week trend pattern for the TRX/BTC market.
At the beginning of the week we saw a bullish trend for a while, after which it entered a bearish trend showing that the market is not yet stable and both buyers and sellers are trying to control the market.
At the bullish trend, the buyers were in control, and when it was bearish the sellers were in control. As at today it is in a ranging phase as seen in the image displayed.
When it entered a ranging phase, the buyers and sellers struggle for control of the market.
After the initial point where it touches support it continues to fluctuate and does not hit it anymore, likewise the resistance.
Buyers and sellers can take advantage of this ranging phase to make profit.
This pattern continues onwards and I believe the price of the market might be in a ranging phase for a while.
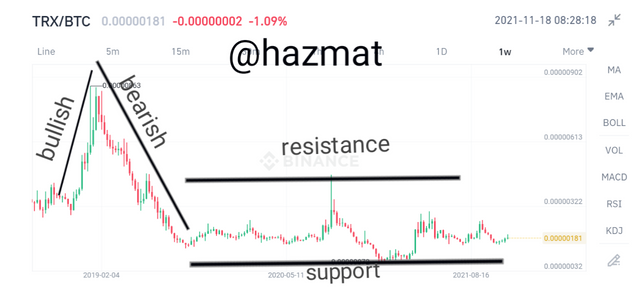
Image designed on Pixellab
All images used are sourced from my Binance account
CONCLUSION
Knowing how to monitor trends and how they affect the market structure is very important as a trader.
The cryptocurrency market is one that is very risky and can be very easy, all of this depends on whether the trader is aware of the data and can correctly make an analysis.
Understanding trends is just one of many way in which traders monitor what goes on in the market, other tools can also be explored to improve data analyzed from the market.
This was a comprehensive lecture and very important for me personally, as i have improved my knowledge of trending market and why we should study them.
I look forward to your review professor@reminiscence01.
Hello @hazmat, I’m glad you participated in the 1st week Season 5 of the Beginner’s class at the Steemit Crypto Academy. Your grades in this task are as follows:
Recommendation / Feedback:
I'm impressed with your submission. Thank you for participating in this homework task.