DONCHIAN CHANNELS :Crypto Academy / S5W1- Homework Post for professor @lenonmc21
Good day everyone, I'll be making my post for the cryptocurrency season 5 week 1 lecture on Donchian Channel, provided by professor @lenonmc21.
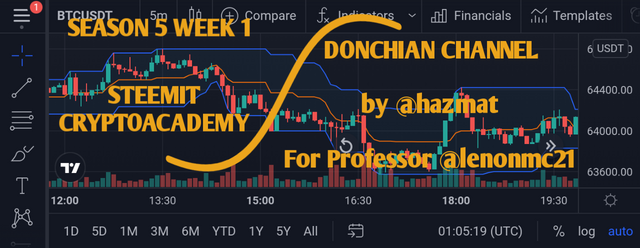
Image designed on Pixellab
THEORY

1 Explain and define in your own words what the Donchian Channel are?
INTRODUCTION
Donchian Channel a type of indicator tool used to make technical analysis of market volatility in relation to variation of price and breakouts in it's trends.
Invented by Richard Donchian it consists of three main parts.
•Upper Band
•Lower Band
•Median or Middle Band
The upper band is gotten by checking for the candle formed at the highest price for a certain period, the lower band likewise is for the lowest price at that period.
The median or middle band like the name suggests is at the middle and is an average or half of both.
Donchian Channel are particularly useful to analyze the price volatility of a market.
When there is a stability in the price of the market the channel can be seen to form a narrow pattern. But when there is variation in price, the pattern fluctuates and the channel forms a wide pattern.
Although the Donchian Channel is a very useful indicator it is pertinent to note that data is not hundred percent for making market analysis, traders would do well to combine them with other trading indicators.
They are quite effective as a comparison for market price over a time period
USES OF DONCHIAN CHANNEL
• The Donchian channel was developed by Richard Donchian but traders have made variations that suit them showing their versatility.
• The indicator is quite useful for checking volatility of price. Fluctuations show a wide channel while stability shows a narrow one.
• It is a graphical representation of pattern formed by the price variation, making it a lot more visual in information.
• Used for trading of breakouts.
• Used for trading of pullbacks.
• Used for trading of reversals.
2 Does it explain in detail how Donchian Channel are calculated ( without copy and paste from the internet)
Understanding how Donchian Channel are calculated can be quite helpful to a potential trader or an existing one.
As mentioned earlier the Donchian Channel is comprised of three main parts which are the upper band, lower band and the median band.
The Donchian Channel lines are usually for a certain number of period of time
The candle with the highest price for that period become our point for the upper band, while the candle with the lowest price become our lower band for the period of time.
At the center is the average which points us to the median band or middle band.
Period is usually denoted as an n but can be subject to the traders interpretation.
Upper band = The highest price for the period. (Ub)
Lower band = The lowest price for the period. (Lb)
Median or middle band = Upper + Lower divided by 2. (Mb)
Mb = (Ub + Lb)/2
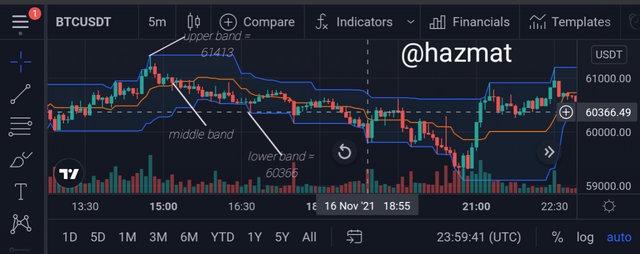
Example
n is a four day period
Ub = 61413
Lb = 60366
Mb = (Ub + Lb)/2
Mb = (61413 + 60366)/2 = 60889
The Median band is at 60889
Note : Example is my own interpretation just for calculation basis
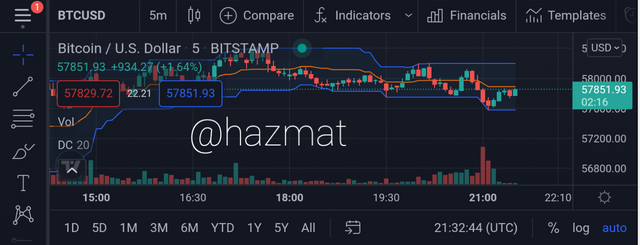
Images were sourced from the tradingview site
3 Explain the different types of uses and interpretation of Donchian Channel
Donchian Channels is a tool that can be used in a number of ways to serve various purposes.
Major amongst them is that they serve as an interpretation for data monitoring on
•Volatility
•Overbought and Oversold region
•Trend breakout
•Volatility
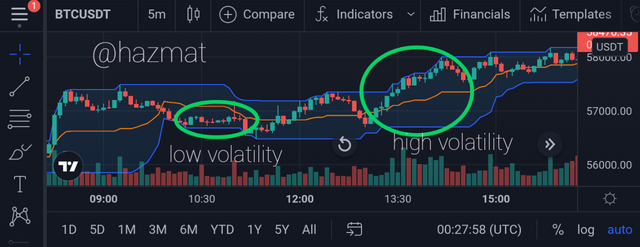
Perhaps one of the most important use of the Donchian Channel is for the monitoring of volatility of market.
When the pattern formed by the bands shows a narrow or close formation it indicates that there is stability and volatility of the price is on the low side.
While we have a high volatility for cases where the pattern is wide or in a very open formation.
As a trader knowing how to monitor these can be very advantageous.
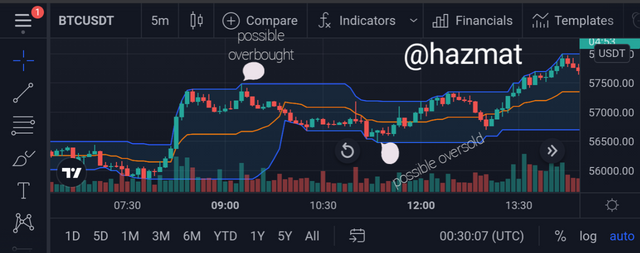
•The Overbought and Oversold region
Another use of the Donchian Channel is the relation of price in the overbought and oversold region.
When the price is at the upper band this is regarded as the overbought region or point and usually there is a reversal in the trend. Reversal shows that sellers might be trying to take over the market.
The oversold region is at the point where the price is at the lower band and likewise a reversal in trend is usually seen.
Traders can take advantage of the overbought and oversold region to make profit.
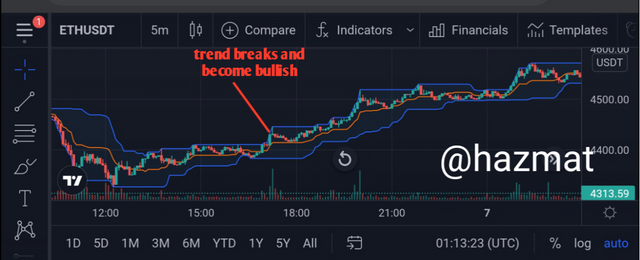
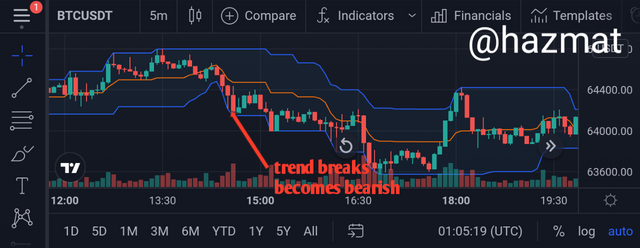
•Trend Breakouts
This relates that it is not always we can have a reversal at the upper band for the overbought, or at the the lower band where we have the oversold.
Sometimes a trend breakout and such cases the trend does not change but continues. This shows that overbought and oversold do not always occur hence traders have to be very careful.
At the overbought the trend continues upward forming what can be a bullish trend, and a downward continuation forms a bearish trend at the oversold signifying it is a strong trend.
All images are sourced from tradingview site
PRACTICE
Make 1 entry using the "Donchian Channel Breakout strategy" and 1 entry using the "Reversal and Retracement strategy".
Reversal and Retracement strategy
After the candle made a Reversal I enter the market when a bullish candle was formed, following previous reversal I believed at least there would be formation of two more bullish candle.
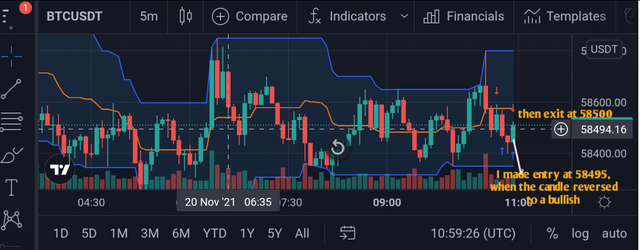
I made entry when the bullish candle formed at 58459.78 after a reversal, then made a sell point at 58500.91
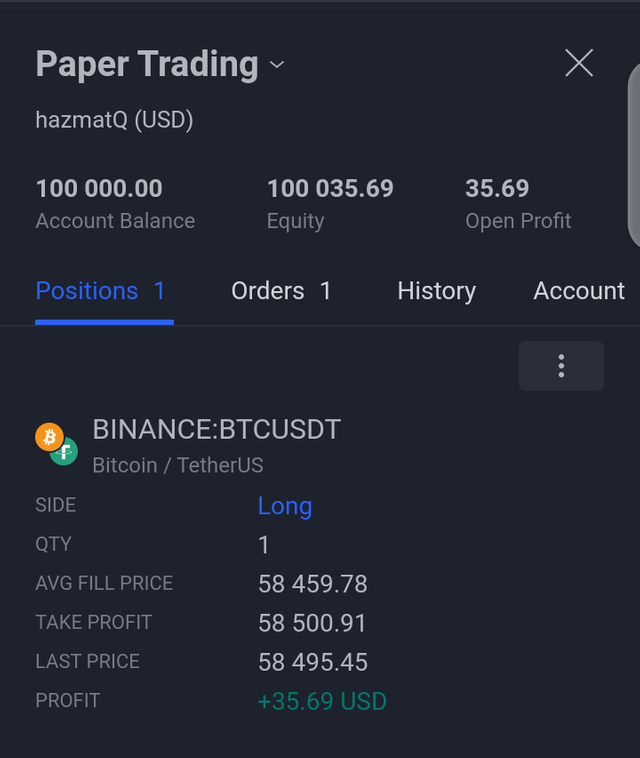
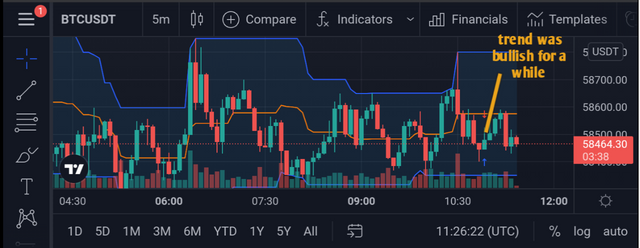
My prediction of at least next two candles being bullish according to the previous reversal pattern was correct and i made my sell.
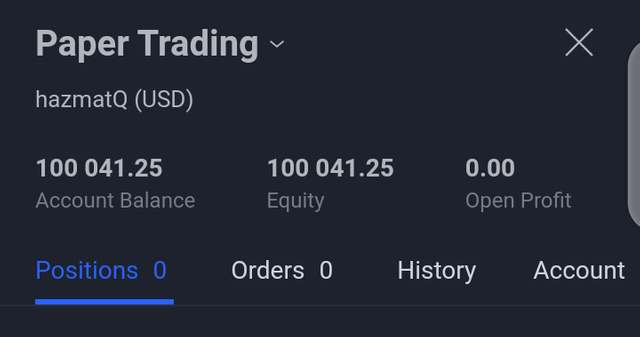
This is the balance after I took profit at 59500, a small profit but a profit nonetheless.
All images are sourced from tradingview site
CONCLUSION
This lecture is an opening for me into the Donchian Channel as i previously wasn't aware of such a tool.
Like a lot of indicator tools Donchian Channel is not an excellent and 100% sure analysis tool and trader would best use it alongside other monitoring tools.
Looking forward to your review of my post professor @lenonmc21.