Steemit Crypto Academy Season 5 Week 4 [Beginner's Course] - Trading Using Rectangle Pattern
This is my post for the steemit cryptoacademy
lectures for the fourth week of season 5.
Having read the lecture on how to trade with the use of rectangle pattern, join me as i answer the questions for the lecture under the topic
1 Explain Rectangle pattern in your own words.
A pattern is the system or shape which something conforms to, being that we can see a characteristic appearance of its formation.
Market price pattern is usually in two forms seen in trending patterns and ranging phase. The trending pattern is either an uptrend or downtrend while a range is neither the two but a fluctuation in between.
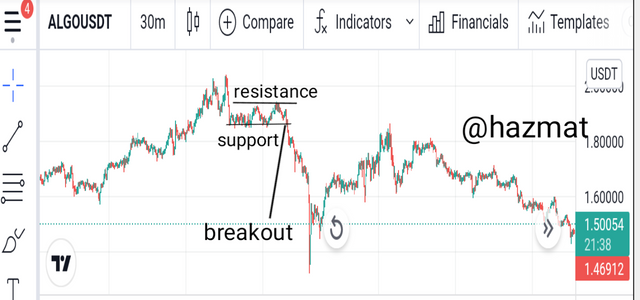
A rectangle is a four sided shape. The rectangle pattern is one which is thus formed between two trendlines, a support and a resistance in an horizontal movement.
It is easily recognizable due to the rarity of it's formation as it touches at least two point on the support as well as resistance without breaking the line thereby creating a sort of ranging price movement.
The Rectangle pattern can thus be defined as a type of pattern with price moving between two horizontal trendlines of both support and resistance with resistance at the top and support at the bottom without breaking the line.
Upon breaking the any of the trendline after rectangle pattern formation we say there is a breakout signaling the end of the rectangle.
It's formation occurs when the price is rising or dropping in a bullish or bearish trend. When rising the price meets a resistance and drops, again it meets a support and goes back up to meet the resistance again.
The same is applicable when price is dropping or in a bearish trend, it meets a support then goes up to meet a resistance.
It is this continuous movement that leads to rectangle pattern formation.
Some buyers take advantage of this by buying when price is at support and then selling when it meets resistance, while others wait to see if price will breakout at the resistance or support trendline.
2 How to identify Rectangles
To identify Rectangles formation on the price chart there are a number of information we look at.
• PRICE MOVEMENT
A rectangle pattern is usually formed following the movement of price pattern after a bullish or bearish trend as it enters a ranging pattern.
It is this ranging movement of the price that causes the formation of the rectangle. The bullish or bearish trend formed before the rectangle tells us the type of rectangle formed.
We have a rectangle bottom if the price movement is in a downward trend or downtrend while for rectangle tops it is in an upward trend or uptrend.
• TRENDLINE
As earlier mentioned the price is between two trendlines which are horizontal with one at the top known as the resistance and the other at the bottom known as the support.
For a rectangle to form the price pattern is in a spaced movement between both trendline without breaking them whilst also touching both trendlines at least twice on support and resistance.
A rectangle pattern is formed once this criteria is successfully established hence it can also be identified with those characteristic traits.
3 Can indicators be used with this pattern to get accurat results?
As a trader it is very important to note that the cryptocurrency market is very risky hence the need to adopt different trading strategies.
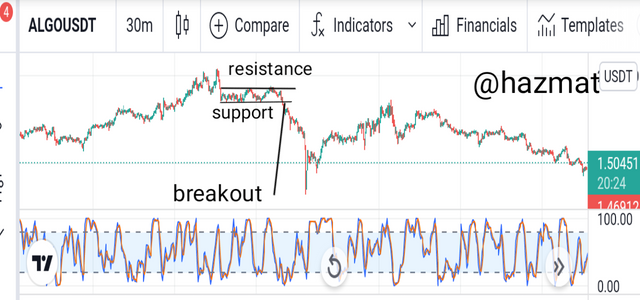
So yes, we can use technical indicators with the pattern as making analysis using startegy from just price patterns alone do not provide very accurate analysis since price can move in any direction.
Using only price trend as an analysis could be quite risky as price can move in an unexpected direction or pattern making a trader fall victim of a fake signal.
However additional use of technical indicators alongside the pattern provides more technical analysis on the market thus further improving accuracy of the trading predictions and data analysis.
Although it is also worthy to note that use of technical indicators also do not provide a perfect analysis, they go a long way in improving the efficiency of the data analysis made.
4 Give explanation of Rectangle tops and Rectangle bottoms.
There are two types of Rectangle formed known as Rectangle tops and Rectangle bottoms depending on the location of it's formation.
• RECTANGLE TOPS
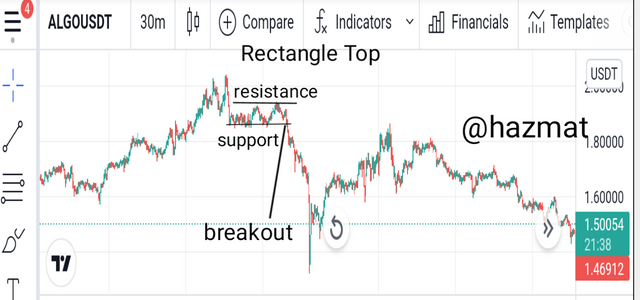
Rectangle tops are patterns in the shape of a rectangle which is formed after an uptrend or a bullish trend and is located at the top of this trend.
The pattern upon formation could either continue in an uptrend after the Rectangle or we see a reversal into a downtrend. Traders monitor this formation to see if breakout is at the resistance or support.
A breakout at resistance means that the uptrend could continue making it a buy entry for traders while a breakout at resistance means that sellers could sell their assets while waiting for a reversal in trend and a price drop.
• RECTANGLE BOTTOMS
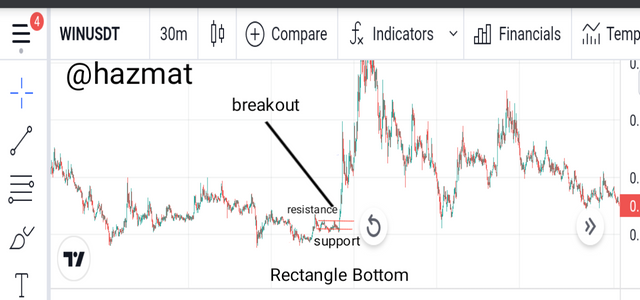
This rectangle pattern is the opposite of Rectangle tops. The Rectangle bottom is formed at the bottom of a downtrend.
Depending on whether price pattern makes a breakout at support or resistance, the price continues in an uptrend or a reversal into a downtrend.
A breakout at support means that the trend could continue onwards in a downtrend hence traders make a sell entry at this point while waiting for price to drop. A breakout at resistance could indicate a reversal of trend into an uptrend, hence buyer make entry waiting for price to rise.
5 Depict a full trade setup with use of this pattern for both trends.
I will be showing a trade setup for both a buy trade and a sell trade
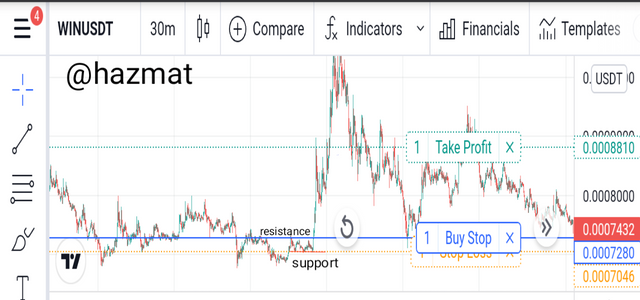
BUY TRADE
The chart displayed above is one for the WIN/USDT.
Price made a breakout at the resistance which is the top trendline hence we see a subsequent upward movement of the price.
At the resistance trendline breakout I made a buy entry at 0.0007210, a stop loss was made at 0.0007046, and then my take profit was at 0.0008810.
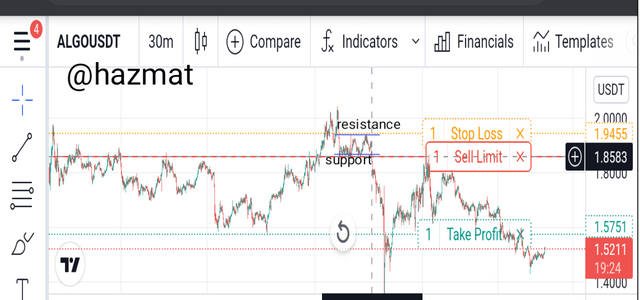
SELL TRADE
The chart displayed above is a chart of the ALGO/USDT.
Price pattern made a breakout on the bottom trendline which is the support hence the subsequent downward movement of the price.
At the support trendline where price made a breakout, i made my entry point at 1.8583, my stop loss was set a higher point at 1.9455, then my take profit was set at 1.5251
CONCLUSION
Understanding of the formation of Rectangle patterns and how it relates to subsequent price formation can be very advantageous to a trader.
Studying the movement of price in the market can affect whether a trader makes a buy entry or a sell entry and when to make an exit.
Hence this is why understanding how and why patterns such as Rectangles are formed and how to apply them to trade is very important to a trader.
I enjoyed studying how Rectangles pattern are formed on the price chart. Looking forward to your review of my work professor @sachin08.
