Steemit Crypto Academy Season 4 Beginers' Course -Homework Post For Task 10: Candlestick Patterns.
Explain the Japanese candlestick chart?
In your own words, explain why the Japanese Candlestick chart is the most used in the financial market.
Describe a bullish and a bearish candle. Also, explain its anatomy.

Explain the Japanese candlestick chart?
Candlestick Chart
Candlestick chart in general has its origin from Japan in the 1700s. Munehisa Homma a Japanese rice trader discovered that the rise and fall of rice price was strongly linked to the emotions of the traders.
By studying the patterns in which they affected demand and supply, he was able to form the basis of the candlestick chart.
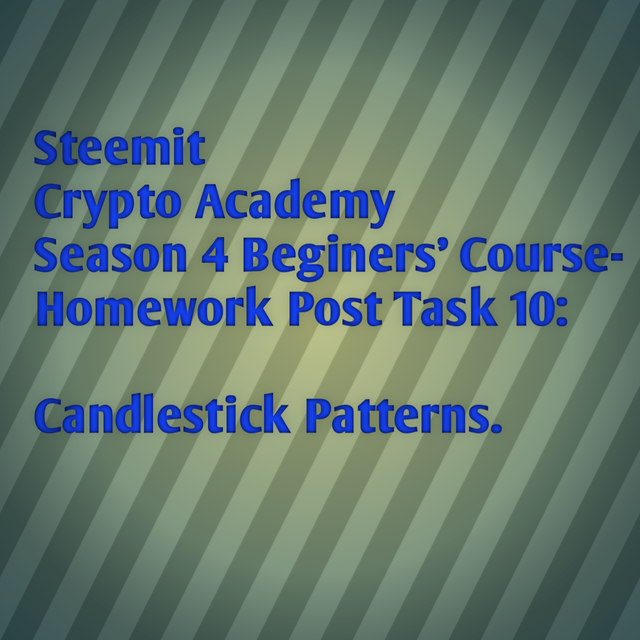
Candlestick chart is a graphical representation of market price changes. By studying the patterns which the candlestick are formed buyers and sellers can make future projections of price direction.
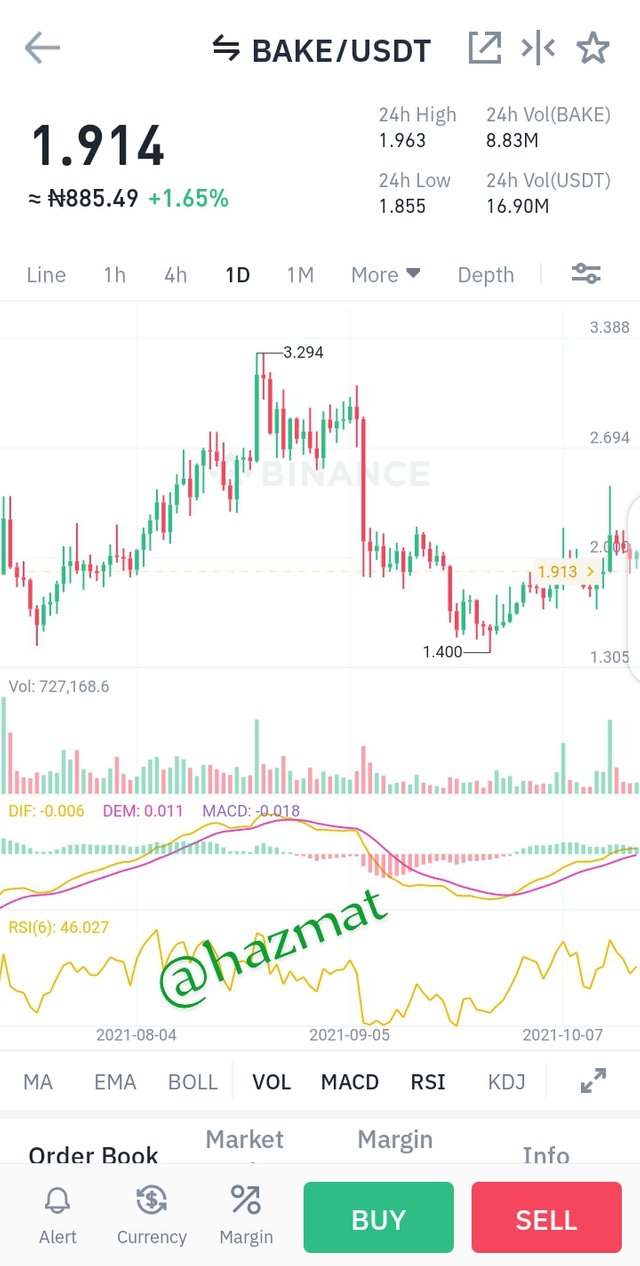
Image Sourced from my Binance account
In cryptocurrency trade, the Japanese candlestick chart is used to point changes in trading patterns and show whether buyers or sellers are in control of the market price and how best to make future investment that would tip the scale in the traders favor.
In essence, the candlestick chart are used to analyze how price changes and the reaction such changes make in the market.
In your own words, explain why the Japanese Candlestick chart is the most used in the financial market
Today the Japanese candlestick chart is most used because of the amount of detail that can be gotten from the graphical representation.
Trading is quite risky, and access to Information is very paramount. The information on Japanese candlestick chart can be readily accessed, understood and is more detailed compared to the line chart.
The Japanese candlestick chart uses a visual representation to display details such as opening and closing price, high and low points and they can be viewed on each candlestick, this is a major determinant to know whether market is becoming bearish or bullish.
Deviation in price can be viewed over a particular time period and projections can be made on its relation to the demand and supply within that time period.
Describe a bullish and a bearish candle. Also, explain its anatomy
Bullish Candle
The bullish candle is a candlestick pattern which signifies a reversal in a downward trend to an upward trend.
.png)
Here the buyers are in control of the price, it's length is determined by how long the buyers can continue to stay in control of the price.
Anatomy
The anatomy of a candlestick is determined by four basic elements which are open, high, low, and close of the price also know as OHLC.
•Opening price
It signifies the opening of the price or beginning of the candle either for a Bullish or bearish candle.
•Closing price
It signifies the closing of the price or end of the candle either for a Bullish or bearish candle.
•Highest price
This is the highest point the price reaches in a given time.
•Lowest price
It signifies the Lowest point the price reaches in a given time.
The bullish candle is usually depicted as a green candle with the opening below the candle and the closing at the top of the candle.
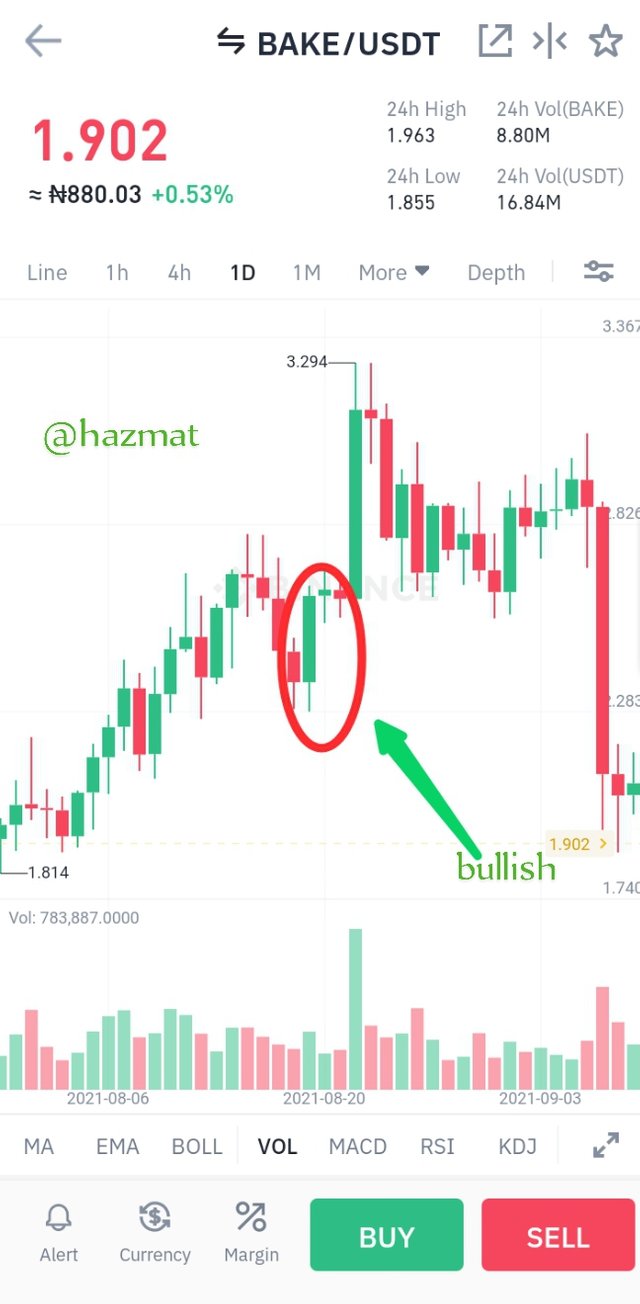
Image Sourced from my Binance account
It's shows that buyers are in control of the price at that time. Sustenance of the price control by the buyers factors in on how long it will be formed
Bearish Candle
The bearish candle is a candlestick pattern that signifies a change in an upward trend to a downward one.
.jpeg)
This time around the sellers are in control and like the bearish candle, it's length is determined by how long they can continue to influence the price
Anatomy
The same elements that determine the anatomy of a bullish candle is also used for bearish candle.
Image sourced from my Binance account
The bearish candle is depicted as a red candle with the opening at the top of the candle and the closing at the bottom of the candle.
CONCLUSION
Understanding candlestick patterns is quite advantageous when trading.
As they offer some indication as to whether the market is bullish or bearish and whether a trader should buy, sell or wait for a change in trend.
Although other factors determine price changes and dependent on only the Candlestick charts for analysis is not advised, to some extent they serve as a measure for future projections.
This has offered me a basic knowledge of the patterns i see most of the time on my Binance account and i can see the significance as to why they are important to understand.
I look forward to your review of my post professor @reminiscence01, this was a well enjoyed lecture.
#club5050 😀