SEC S18-W4 || Mastering Liquidity Levels in Trading
Aslam ul Alaikum I hope you all are good.
In the world of trading I have learn that Liquidity is very important. Liquidity mean how Easily you can buy or sell an asset without changing its price too much. Knowing about liquidity has help me trade better make smarter choices and manage risk. In this entry I want to explain why liquidity matters. I will talk about how it affects the cost of trading market stability and how easy it is to trade asset. We will look at what influences liquidity like trading volume and economic events and discuss ways to manage it. My goal is to share useful tips for trader and investor. Lets explore together how Understanding liquidity can open up more opportunity and make trading more Successful.
Concept of Liquidity Levels in Trading |
|---|
From my experience liquidity levels are specific price point on a chart where there are lots of buy or sell orders. These levels are important because they show where there's enough market activity to make big trades without causing large price changes.
Why Liquidity Levels Are Important for Traders
Ease of Buying and Selling: High Liquidity levels make it easier to buy or sell assets quickly Without changing their price much. For example if you are tryng to sell 1000 share of stock liquid markets will let you do this smoothly without dropping the stocks price signifcantly .
Reduced Slippage: slippage happens when the price you get is different from the price you expect. In liquid markets slippage is les likely so you get the price you want more often. This is crucial for sticking to your trading plans and avoid unexpected loses.
Lower Transaction Cost: When a market is liquid the difference between the buy price and selling price ( bid ask spread) is small. This mean lower cost for making trades saving you money .
Market Stability: Liquidity help keep the market stable. Large trades don't cause big price swings in liquid market making it easier to predict price movement and make informed decision.
Indicators and Tools to Identify Liquidity Level
- Volume Profile: This tool show how much trading has happened at different price level over a period of time. For example if a lot of trades happened at $50 the volume profile will show a peak at that price indicating high liquidity.
.png)
- Order Book Analysis: The order book list all current buy and sell order. By looking at the order book you can see where there are lot of orders clustered which indicate high liquidity. For instance if there are many buy orders at $100 its sign that $100 is liquidity level.
.png)
Support and Resistance Levels: These are prices where the asset often stops moving higher (resistance) or lower (support). For example if a stock frequently bounces back when it hits $40 $40 is a support level with high liquidity.
Moving Averages: These are average prices over certain period and can show areas of high trading activity. For instance if a stocks 50 day and 200 day moving average are close together this price range might have high liquidity.
Price Action: By looking at the shapes and patterns of price movements on the chart you can spot liquidity levels. For example long wicks on candlesticks might show Where lot of trading happen but the price didnt move much indicating high liquidity.
VWAP (Volume-Weighted Average Price): This indicator gives the average price based on both volume and price for the day. It shows where most trading happened. If the VWAP is at $75 it suggests $75 is a high liquidity level.
.png)
Real-Life Example: STEEM Coin
Let look at a real life example with STEEM coin:
- 24 HR RANGE: 5.06%
- 24 HR LOW: $0.224749
- 24 HR HIGH: $0.236721
- LIQUIDITY ±2%: $348.01K
- BIDS -2%: $185.94K
- ASKS +2%: $162.07K
In this example the STEEM coin has a liquidity level of ±2% at $348.01K. This means there is significant trading activity within 2% of the current price. There are $185.94K worth of buy orders (bids) and $162.07K worth of sell orders (asks). This high level of liquidity helps traders buy or sell STEEM coin with minimal price impact reducing transaction costs and slippage.
Understanding and finding liquidity levels is key for successful trading. These levels help you buy and sell easily reduce unexpected costs and make better trading decisions. Using tools like volume profile order book analysis support and resistance levels moving averages price action and VWAP can help you identify these important price points. By knowing where the liquidity is you can optimize your trades manage risks better and achieve smoother trading operations.
Navigating Fakeouts: How to Avoid Getting Trapped in Trading |
|---|
You know in trading fakeout are like those moments when the market plays tricks on us. It happens when the Price of an asset breaks through support or resistance Level making it seem like a big move is about to happen. But then just when you have jumped into trade thinking you have caught the big move the price Suddenly turns around leaving you stuck in a losing position.
.png)
Why Traders Get Trapped by Fakeouts
Emotional Reaction: Sometimes we let our emotions take over. We see the price break a key Level and fear of missing out or avoiding losses kicks in. So we jump into a trade without really thinking it through.
Stop Loss Orders: We often set stop-loss orders to limit our losses. But when fakeout happen these orders get triggered adding more fuel to the sudden price movement in the wrong direction.
Lack of Confirmation: We might not wait for confirmation from other indicators or market factors. Instead we rely solely on the breakout even if there are sign that it might not be real.
Market Manipulation: Sometimes big players in the market purposely create fakeouts to trick Smaller traders. They trigger stop Loss orders to make the price move in a certain direction benefiting their own trade.
How I Can Avoid Falling for Fakeouts
Confirmation: I have learned to wait for confirmation from other indicators or patterns before trusting a breakout. It helps me separate real breakouts from fake ones.
Volume Analysis: Checking the trading volume accompanying breakout is key. If the volume is not there to support the move its likely a fakeout.
Patience: Being patient has saved me from many fakeouts. Rushing into trades without proper analysis almost alway end in losses.
Using Multiple Time Frames: Looking at the breakout from different time frame gives me a better perspective. A breakout might seem significant on short time frame but insignificant on a longer one.
Risk Management: Setting proper stop loss orders and managing the size of each trade relative to my overall capital help me minimize losses When fakeouts happen.
By staying aware of the possibility of fakeout and following these strategies I can avoid getting trapped and improve my trading success in the long run.
Navigating Liquidity Levels: A Simple Strategy for Trading Breakouts |
|---|
Trading liquidity levels effectively is all about being smart patient and careful. Heres how I do it:
1. Spotting Key Liquidity Levels:
- I use tools like volume profile support and resistance level and moving averages to find important liquidity levels on the chart. These are the price points Where lots of trading activity is Happening.
2. Waiting for the Right Moment:
- I don't rush into trades as soon as I spot Liquidity level. Instead I wait for confirmation from other indicator or market factor. It help me make more inform decision.
3. Checking the Trading Volume:
- One thing I always look at is the trading volume accompanying the liquidity level. If there a lot of trading volume its a good sign that the breakout is real. But if the volume is low I become cautious because it might be fakeout.
4. Confirming with Price Action:
- Another thing I do is analyze the price action around the liquidity level. I look for strong candlestick patterns or momentum moves that support the breakout direction. It give me more confidence in my trade.
5. Considering Different Time Frames:
- I don't just look at one time frame. I check the breakout on multiple time frame to get a better idea of the overall market sentiment. It help me avoid getting trapped in fakeout.
.png)
6. Managing Risks:
- Lastly I always manage my risks properly. I set stop loss orders at strategic levels to limit my losses if the trade goes against me. And I make sure that each trade is size appropriately based on my overall capital.
Signs or Confirmations I Look For:
High Trading Volume: Confirmation from strong trading volume gives me more confidence in the breakout.
Price Action Patterns: I look for specific candlestick patterns or strong price movements that support the breakout direction.
Consistent Breakout Across Time Frames: Checking the breakout on different time frames ensures that its significant and not just a temporary move.
Market Context: Considering the broader market context including news events and fundamental factors help me validate the breakout.
With this strategy and by looking for these signs or confirmations I have been able to trade liquidity level more effectively and avoid getting caught in fakeouts. Its all about staying patient discipline and making informed decisions
Tips and Techniques to Avoid Fakeouts when Trading Based on Liquidity Levels |
|---|
Avoiding fakeouts is crucial for successful trading based on liquidity levels. Here are some practical tips and techniques:
1. Wait for Confirmation:
- Tip: Patience is key. wait for confirmation before entering a trade based on liquidity level.
- Technique: Look for additional signals such as candlestick patterns or indicator confirming the break out. For example wait for the price to closed above the liquidity level on higher time frame to confirm the breakout.
2. Analyze Volume:
- Tip: Pay attention to trading volume accompanying the breakout.
- Technique: Confirm the breakout with a surge in trading volume. High volume indicate strong market participation and reduce the like lihood of fakeout.
3. Watch for Price Action Confirmation:
- Tip: Look for strong price action signal to validate the breakout.
- Technique: Analyze candlestick patterns around the liquidity level. For instance look for bullish engulfing patterns or long bullish candles closing above the liquidity Level to confirm bullish breakout.
4. Confirm Across Multiple Time Frames:
- Tip: Verify the breakout across different time frames to ensure its significance.
- Technique: Check for alignment in the breakout direction on various time frame. For example if the breakout is confirmed on both daily and hourly chart it add confidence to the trade setup.
5. Implement Risk Management:
- Tip: Always manage your risks effectively to protect your capital.
- Technique: Set stop loss orders at strategic levels below support or above resistance to limit potential losses. Additionally consider adjusting your Position size based on the distance to the stop-loss level to maintain proper risk-reward ratios.
Concrete Example with Detailed Steps:
Lets say I m trading Bitcoin (BTC) Which has been hovering around key resistance levels:
.png)
Wait for Confirmation:
- I wait for the price to decisively break above the significant resistance level at $71 720.48. This level represents the price 2 standard deviations above the mean and is a strong indication of bullish momentum.
Analyze Volume:
- I confirm the breakout by observing a substantial increase in trading volume compared to the average volume over the past few days. High volume indicates strong market participation and validates the breakout.
Watch for Price Action Confirmation:
- I closely monitor the price action around the $71 720.48 resistance level. If I see a bullish engulfing pattern or a long bullish candlestick closing above this level it confirms the bullish breakout.
Confirm Across Multiple Time Frames:
- I verify the breakout on multiple time frames especially on the 4-hour and daily charts. Consistency in the breakout direction across different time frames strengthens my confidence in the trade setup.
Implement Risk Management:
- I set a stop-loss order slightly below the breakout level at $71 720.48 to limit potential losses if the breakout fails and turns into a fakeout. Additionally I adjust my position size based on the distance to the stop-loss level to maintain proper risk management.
By following these steps and techniques I can avoid falling for fakeouts and increase the probability of trading successful breakouts based on liquidity levels even in the volatile Bitcoin market.
STEEM/USD Trade Analysis with Liquidity Levels |
|---|
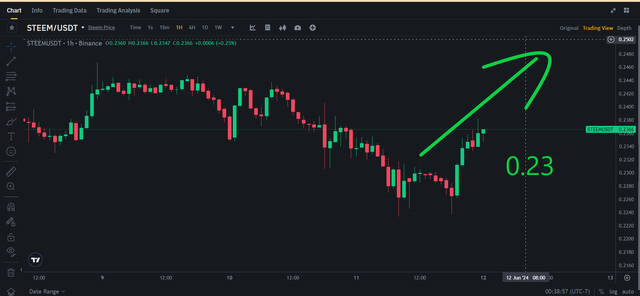
Analyzing the STEEM/USD Chart (4-hour timeframe):
Looking at the 4-hour chart of STEEM/USD we can identify potential liquidity levels based on price action and volume:
- Support: $0.2355 (recent swing low round number acting as psychological support)
- Resistance: $0.25 (horizontal resistance zone from previous consolidation)
Potential Trade: Long Trade with Confirmation
Reasoning:
STEEM has shown positive performance across most timeframe indicating an Upward trend. The bounce from the $0.22 support level with decent volume suggests buying pressure. However to avoid potential risks of a fakeout we need confirmation before entering long trade.
Steps:
Wait for Confirmation:
We won't jump into a long trade right away at $0.22.Confirmation:
We'll wait for a breakout above the resistance zone at $0.25 looking for:- Price Action: A bullish candlestick pattern like an engulfing bar or breakout bar with Clear rejection wick at the resistance zone.
- Volume: An increase in volume compared to the past few bars indicating strong buying Pressure behind the breakout.
Entry:
If the confirmation criteria are met (breakout above $0.25 with bullish price action and volume surge) we will enter a long trade (buying STEEM/USD).
Stop Loss and Take Profit:
- Stop-Loss: Place a stop loss order below the confirmation candlesticks low (around $0.24) to limit potential losses if the price falls back below resistance.
- Take Profit:
- Target 1: $0.28 (previous resistance level turned support)
- Target 2: $0.32 (based on a 50% Fibonacci retracement of the recent upswing from $0.22)
i am inviting: @aviral123 @waqarahmadshah @ayijufridar
Nice entry. Referring Order book is must needed to understand how the liquidity in a asset. Crypto exchanges like binance and gate.io has lot liquidity than other crypto exchanges. In binance and gate.io we mostly get buyers and sellers close to a current price that means it will not effect the current price. However, in other exchanges there is big gap we see in buyers and sellers like if a current price is $ 10, we see seller at $ 12 and buyer is on $ 9, means if we try to buy by market price we will get at $12 instead current price $ 10 and then if we sell it at $ 9 we will in loss of $ 3. Addtionally we can see how price is affected between $ 10, $ 12, $ 9.
Congratulations, your comment has been successfully curated by our team via @steemdoctor1 at 5%
Thank you for the insightful comment! You make an excellent point about the importance of referring to the order book to understand liquidity in an asset.
Upvoted. Thank You for sending some of your rewards to @null. It will make Steem stronger.
@hamzayousafzai Amazing.
Liquidity levels are important in trading because they ease the process of buying and selling, minimize loss, lower transaction costs, and help in stabilizing the markets. Identifying these levels using tools such as volume profiles order book analysis and support and resistance levels helps traders optimize their trades and manage risks. Wait for confirmation examine volume, and managing risks are key strategies to avoid falling into the fake-out trap. By applying these principles traders can make more informed decisions and improve their trading success.
thanks for the feedback
Hi @hamzayousafzai
Many thanks for sharing. You have presented very nicely I can see you have nicely drawn support resistance and liquidity levels in your screenshots here. Every thing important for a traders tools must work. A trader never trade anytime anywhere must do a lot of analysis and invest his assets waiting for market liquidity and important news. steem analyze is really ok. The next uptrend we will definitely see in this price.
Thank you for your kind words! I'm glad you found the analysis and screenshots helpful. Indeed drawing support and resistance levels along with understanding liquidity are crucial aspects of trading.
Your post has been successfully curated by our team via @steemdoctor1 at 35%.
Thank you for your committed efforts, we urge you to do more and keep posting high-quality content for a chance to earn valuable upvotes from our team of curators and why not be selected for an additional upvote later this week in our top selection.
I read your post you tell about the traders and tips and techniques of fake outs these points you can explain very nicely way I really enjoy when I read your post. It's interesting contest I have also participated in it ...
Best wishes 💞
Thank you so much for your feedback ☺️😌
You have explained liquidity level to my own understanding by bring in all the necessary tools to look into before taking a trade.
You have mentioned the volume, VWAP, support and resistance and even the order book. I believed if all this is put in checked, all the noise in trading will reduce as we carry out our trade effectively. Thanks for sharing this great knowledge.
Wishing the best.
Sin lugar a dudas la ubicación de la liquidez en una tendencia es muy interesante. Los traders pueden contar con herramientas muy versátiles para determinar los niveles de soporte y resistencias, las falsas rupturas y los volúmenes de operaciones. Es una combinación de ellos que ayudan a dar el siguiente paso, tomar decisiones informadas.
Gracias por compartir, saludos y éxitos.
You're really on point with your trading strategy. It's all about being patient and careful. I see you're using tools like volume profile, support and resistance levels, and moving averages to find those key liquidity levels on the chart. Waiting for confirmation and checking trading volume are smart moves to avoid fakeouts. Analyzing price action and considering different time frames give you a well-rounded view. Managing risks with stop-loss orders and proper trade sizing is crucial for success. Keep up the great work.